Printed from acutecaretesting.org
October 2013
Optimizing blood gas testing


Today’s healthcare environment presents many challenges to laboratorians or clinicians responsible for arterial blood gas (ABG) testing. They are expected to do more with less staff, contain testing costs, and comply with increasing regulatory requirements—without sacrificing testing quality.
In addition, due to the nature of ABG testing, clinicians cannot afford to waste time or resources when making decisions based on an ABG sample analysis. To ensure accurate results for such decision-making, it is imperative that the analytical process be as standardized and finely calibrated as possible. For example, variations in technique in the areas of specimen preparation, turnaround time (TAT), handling, and analysis can all affect test results [1].
In the face of these challenges, a new focus on issues of sample integrity, operator safety, data accuracy, and workflow efficiency has emerged. These factors are all critical components of maintaining and improving quality. In order to identify opportunities for improvement, healthcare organizations must understand and examine these factors in all phases of the testing process.
SAMPLE INTEGRITY
Strategies to ensure sample integrity are of the utmost importance. These strategies may include the use of technologies to reduce room air contamination and to automatically mix a sample.
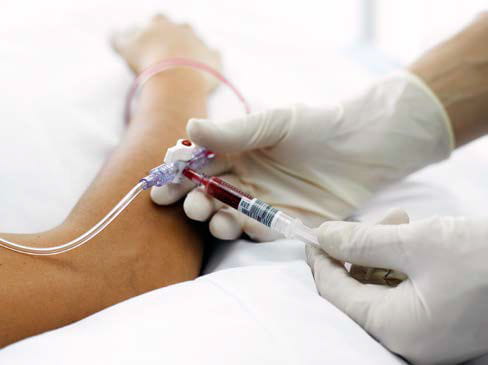
Air bubbles are common during draws. They should be expelled as soon as possible after drawing a sample and before mixing it with heparin. Even small air bubbles can seriously affect a sample’s pO2 value. A bubble with a relative volume of 0.5% to 1.0%% of the blood in the syringe could potentially cause significant error [2], resulting in incorrect patient treatment and prolonged length of stay.
One way to prevent room air from contaminating the sample is to use a syringe with a vented tip cap. This device can easily expel air and seal the sample. The tip cap stays on during measurement to prevent further room air contamination.
Clots in the analyzer can give faulty values and result in unnecessary downtime. If the sample is mixed poorly, the likelihood of clotting increases. In fact, the formation of clots in the sample can block the sample pathway of the blood gas analyzer itself and invalidate test results. To reduce clots, heparin should be mixed into the blood sample as soon after the draw as possible. An integrated mixing ball in one syringe design facilitates manual mixing.
The Clinical and Laboratory Standards Institute (CLSI) guidelines recommend that whole blood samples be mixed for 1 minute immediately prior to analysis [3]. If a sample is visibly sedimented, it needs to be mixed for several minutes [2]. Incomplete mixing has been shown to cause inaccurate tHb results [4].
OPERATOR SAFETY
Safety is a top priority when obtaining a blood sample. Unfortunately, blood exposure and needle stick injuries are common.
A 2012 article in the New England Journal of Medicine reported 23,908 such injuries in 85 hospitals in 10 states (1995 to 2005) [5].
The most common causes of needlestick injuries are:
- the unavailability of safety devices
- lack of procedures for operator safety
- ignorance of safety procedures in place [2]
Removing a safety device poses the risk of injury to the operator, and the hospital risks regulatory non-compliance. Fortunately, technologies are now available that promote operator safety. A safety-designed syringe that forms a closed system minimizes blood exposure. Needle shield devices that offer single-hand activation that cannot be disabled are one possible option.
At least one syringe on the market “clicks” to signal correct activation and is irreversible once activated. When Kaiser Permanente San Diego used this device, it reported only two needlesticks in 35,000 draws by respiratory therapists between 2007 and 2009. The two needle sticks that occurred were related to staff training. (Staff didn’t listen for the syringe to click.) [1]
Every instance of blood exposure constitutes a risk of contact with potentially infected blood. When working with an open syringe system, exposing oneself to bloodborne pathogens is possible. As noted, air bubbles need to be expelled after a draw. However, in an open system, the operator must expel blood into a piece of gauze—risking exposure to pathogens. Then, prior to measurement, blood must again be expelled from the syringe tip to prevent clots from entering the analyzer—posing another risk of blood contact.
Properly designed, a vented tip cap can form a closed system by allowing expulsion of air through it, and by remaining on the syringe during transport and measurement. At least one available product allows for aspiration into the analyzer through the tip cap, maintaining a completely closed system after collection, which further decreases blood exposure.
DATA ACCURACY
Specimen labeling errors have significant consequences for patient care, healthcare management, and costs. The U.S. Joint Commission on Accreditation of Healthcare Organizations (JCAHO) has listed improving the accuracy of patient identification as a principle National Patient Safety Goal for 2013 [6].Ensuring accurate specimen labeling is critical because errors resulting from a failure in this step can, at best, provide results of no clinical value and, at worst, lead to the most adverse of patient outcomes. The majority of errors in specimen labeling typically occur not because of a failure to have policies and procedures in place, but due to failures in workflow or process. Improperly labeled ABG specimens present additional issues [6].
At Loyola University Medical Center in Maywood, IL, Stephen E. Kahn, PhD, DABCC, FACB, professor, Pathology, Cell Biology, Neurobiology and Anatomy, and vice chair, Laboratory Medicine, reports that a random monthly audit indicated that roughly 5% of specimen labeling errors occurred with ABG specimens. Often an ABG specimen is irreplaceable, leading to relabeling by an acute care worker who drew the specimen. Sometimes the specimen must be discarded [6].
Automated data registration at the beside reduces the risk of a sample mix-up. Technologies include barcoded collection devices that allow patient and sample identification to be linked during sample registration and again with the result on the analyzer. This ensures the right patient, the right sample, and the right result, so clinical diagnosis and decision making can be quickly executed.
Barcoded collection devices allow patient and sample IDs to be
linked during sample registration and again with the result on
the analyzer
The Joint Commission Safety Goals require the use of at least two patient identifiers when providing care, treatment, and services [7]. Recommendations include:
- Make sure orders correlate with the patient’s name.
- Identify the sample device at the site of collection (e.g., attach the patient identification label and use a pre-barcoded arterial syringe) [2]
- Enter a patient’s identification into the analyzer before analysis [2].
- Use barcode readers [2].
Using automated data registration eliminates manual data entry at the analyzer. In some instances, staff has had to memorize the patient identification and bed number until arriving at the analyzer. There, they must enter the data manually—leaving a potential risk for transcription errors.
The ability to send reported test results to where they are needed increases patient safety and aligns with National Patient Safety Goals. Ideally, a test result in a laboratory information system (LIS) will be delivered to both the bedside and the electronic medical record (EMR). In order for that to occur, all of the steps in the process need to be linked together electronically.
Kaiser Permanente reported two noteworthy metrics when using an automated system:
- Critical result reporting times were brought down to 15 minutes or less.
- Transcription errors were reduced significantly.
While ABG volumes grew from 2,025 in 2007 to 10,454 in 2010, reporting, labeling, and handling greatly improved in that same period. For example, before using an automated system, up to 25% of samples were not labeled. Now the process is automatic. TAT has also improved over the period by 28% [1].
WORKFLOW EFFICIENCY
It is imperative that ABG test results are delivered as quickly as possible. Using EMRs can help to achieve this, while also meeting requirements defined by the Centers for Medicare and Medicaid Services regarding Meaningful Use. Eligible professionals can receive up to $44,000 through the Medicare EHR Incentive Program and up to $63,750 through the Medicaid EHR Incentive Program [8].Mapping workflow, identifying gaps, and streamlining the testing process can also help to improve TAT and overall efficiency. By understanding the workflow, laboratorians can determine which elements of technology make the most sense to implement. The best way to do this is to physically track each step of the process.
Jay Jones, PhD, DABCC, FACB, director of chemistry and regional labs, The Department of Laboratory Medicine at Geisinger Health System, Danville, PA, did just that after learning that physicians in the cardiovascular operating room (CVOR) reported a 15-minute TAT [9] for blood gases performed in a central lab connected by a pneumatic tube system. The central lab’s average TATwas 2.5 minutes [10].
Dr. Jones examined the testing process from the time a test was ordered to when the result was reported back to the clinician. He worked with the STAT lab, perfusionists, information technologists, and physicians to map the workflow at the 403-bed hospital [9]. Direct observation and process mapping of these clinical applications are known as “lean” tools [10]. This helped to identify major testing bottlenecks in the pre- and post-analytical phases [9].
Mapping the workflow revealed that even before the specimen crossed the threshold of the central lab, nine separate steps, averaging almost 8 minutes, were involved in ordering the test and collecting the specimen. Manual tasks such as preparing a paper requisition, labeling the syringe, and phoning the result to staff consumed an average of 2.4 minutes. Mean sample transit time via pneumatic tube was about 4 minutes. Altogether, 36 testing transactions were timed on two shifts over two weeks in both the CVOR and the central lab [9].
Dr. Jones has since implemented several process improvements in a “functional prototype” that is evolving as stakeholders provide input. Information technology and automation are now playing key roles in evaluating a solution. New technologies that are being evaluated include analyzers that feature an automatic sample-handling module designed to work with the manufacturer’s syringe. The syringe is pre-barcoded and incorporates an integrated mixing ball. When placed on the analyzer, the sample is identified by the analyzer’s integrated barcode scanner, then automatically mixed and aspirated. Several pre- and post-analytical steps are eliminated through the use of specialized software [9].
It is anticipated that an improvement in TAT of 50%, a reduction in transcription errors, and a reduction in biohazard exposure to lab personnel will be realized when the prototype is placed into production [11].
Today’s ABG technologies are designed to improve sample integrity, increase operator safety, boost data accuracy, and foster workflow efficiency. Increasingly, clinical laboratories are taking advantage of what those technologies have to offer to overcome the many challenges in today’s healthcare environment.
References+ View more
- Mulligan M. Automated ABG specimen handling, documentation at Kaiser Permanente San Diego: how a marriage of IT and clinical systems improved patient safety, documentation. Respir Therapy. 2011;6(5):48-51.
- McCudden C. Reducing Preanalytical Errors in Blood Gas Testing. Radiometer America Webinar. http://www.radiometeramerica.com/en-us/services/ radiometer-university/webinar-schedule/preanalytics. Accessed August 2, 2013.
- Clinical and Laboratory Standards Institute. Blood Gas and pH Analysis and Related Measurements; Approved Guideline, Second Edition. Wayne, PA: Clinical and Laboratory Standards Institute; 2010. CLSI document C46-A2.
- Grenache DG, Parker C. Integrated and automatic mixing of whole blood: an evaluation of a novel blood gas analyzer. Clin Chim Acta. 2007;375:153-157.
- Phillips EK, Conaway MR, Jagger, JC. Percutaneous injuries before and after the Needlestick Safety and Prevention Act. N Engl J Med. 2012;366:670-67.
- Kahn SE. Specimen mislabeling: a significant and costly cause of potentially serious medical errors. Acutecaretesting.org. April 2005. http://acutecaretesting.org/
en/articles/specimen-mislabeling-a-significant-and-costly-cause-of-potentiallyserious-medical-errors. Accessed August 2, 2013.- 2013 National Safety Goals. The Joint Commission. PowerPoint presentation.
http://www.jointcommission.org/2013_npsgs_slides/. Accessed August 2, 2013.- Centers for Medicare and Medicaid Services. EHR Incentive Programs. http://www.cms.gov/Regulations-and-Guidance/Legislation/EHRIncentivePrograms/index.html?redirect=/ehrincentiveprograms. Accessed July 26, 2013.
- Weaver J. Improve testing turnaround by looking beyond the lab. MLO. 2008;40(3):35.
- Jones J. Using “lean” process mapping to integrate testing to point(s) of care in the clinical enterprise. April 2009. Acutecaretesting.org. http://acutecaretesting. org/en/articles/using-lean-process-mapping-to-integrate-testing-to-points-ofcare-in-the-clinical-enterprise.Accessed August 2, 2013.
- Jones JB, Croall E, Marko M. “Lean” process mapping of arterial blood gas specimen collection, transport, analysis, and resulting from cardiovascular surgery to a central stat lab: identifying process improvements.
References
- Mulligan M. Automated ABG specimen handling, documentation at Kaiser Permanente San Diego: how a marriage of IT and clinical systems improved patient safety, documentation. Respir Therapy. 2011;6(5):48-51.
- McCudden C. Reducing Preanalytical Errors in Blood Gas Testing. Radiometer America Webinar. http://www.radiometeramerica.com/en-us/services/ radiometer-university/webinar-schedule/preanalytics. Accessed August 2, 2013.
- Clinical and Laboratory Standards Institute. Blood Gas and pH Analysis and Related Measurements; Approved Guideline, Second Edition. Wayne, PA: Clinical and Laboratory Standards Institute; 2010. CLSI document C46-A2.
- Grenache DG, Parker C. Integrated and automatic mixing of whole blood: an evaluation of a novel blood gas analyzer. Clin Chim Acta. 2007;375:153-157.
- Phillips EK, Conaway MR, Jagger, JC. Percutaneous injuries before and after the Needlestick Safety and Prevention Act. N Engl J Med. 2012;366:670-67.
- Kahn SE. Specimen mislabeling: a significant and costly cause of potentially serious medical errors. Acutecaretesting.org. April 2005. http://acutecaretesting.org/
en/articles/specimen-mislabeling-a-significant-and-costly-cause-of-potentiallyserious-medical-errors. Accessed August 2, 2013.- 2013 National Safety Goals. The Joint Commission. PowerPoint presentation.
http://www.jointcommission.org/2013_npsgs_slides/. Accessed August 2, 2013.- Centers for Medicare and Medicaid Services. EHR Incentive Programs. http://www.cms.gov/Regulations-and-Guidance/Legislation/EHRIncentivePrograms/index.html?redirect=/ehrincentiveprograms. Accessed July 26, 2013.
- Weaver J. Improve testing turnaround by looking beyond the lab. MLO. 2008;40(3):35.
- Jones J. Using “lean” process mapping to integrate testing to point(s) of care in the clinical enterprise. April 2009. Acutecaretesting.org. http://acutecaretesting. org/en/articles/using-lean-process-mapping-to-integrate-testing-to-points-ofcare-in-the-clinical-enterprise.Accessed August 2, 2013.
- Jones JB, Croall E, Marko M. “Lean” process mapping of arterial blood gas specimen collection, transport, analysis, and resulting from cardiovascular surgery to a central stat lab: identifying process improvements.
May contain information that is not supported by performance and intended use claims of Radiometer's products. See also Legal info.


Acute care testing handbook
Get the acute care testing handbook
Your practical guide to critical parameters in acute care testing.
Download now
Related webinar
Evolution of blood gas testing Part 1
Presented by Ellis Jacobs, PhD, Assoc. Professor of Pathology, NYU School of Medicine.
Watch the webinarRelated webinar
Evolution of blood gas testing Part 2
Presented by Ellis Jacobs, PhD, Assoc. Professor of Pathology, NYU School of Medicine. Watch the webinar
Blood gas Preanalytics app
Get the Blood gas Preanalytics app for your smartphone
This smartphone app focuses on the preanalytical phase of blood gas testing and what operators can do to avoid errors. Download app
Scientific webinars
Check out the list of webinars
Radiometer and acutecaretesting.org present free educational webinars on topics surrounding acute care testing presented by international experts.
Go to webinars