Printed from acutecaretesting.org
January 2005
Pneumatic tube transport of samples for blood gas analysis


The results of blood gas analysis are usually (although not exclusively) required for the urgent evaluation of critically ill patients in an intensive care setting, emergency room or recovery room of operating theater.
The clinical imperative to reduce turnaround time (TAT) for blood gases is based on the now widely held intuitive view, supported by limited clinical studies, that reduction in blood gas TAT improves patient care [1].
The clinical demand for improved TAT has been met by the installation of blood gas analyzers at the point of care (e.g. in intensive care units and emergency departments) or in satellite laboratories, remote from the central laboratory.
The clinically desirable goal of blood gas TAT of 5 minutes [2] or less can be achieved with this movement of the analytical process from the central laboratory to the patient’s bedside.
This reflects the fact that the largest component of TAT, so far as blood gases are concerned, is the time taken to transport specimens to the analyzer, because the analytical time (typically now less than 1 minute) and reporting time (practically instantaneous with computer reporting facility) are by comparison, vanishingly small.
Modern pneumatic tube transport systems (PTS) that link clinical care areas of the hospital to the central laboratory are increasingly being used to transport specimens.
These systems, which allow samples to be safely delivered to the central laboratory in a few minutes or less, offer the potential for the central laboratory to be once again the site for urgent blood gas analysis, thereby removing the need for POCT and satellite laboratory testing.
A study conducted at Brigham and Women’s Hospital in Boston, Massachusetts [3] confirmed from a logistics and operational view that PTS enables the switch from satellite laboratory testing of blood gases back to centralized laboratory testing.
The authors report a clinically acceptable mean TAT of 6 minutes for blood gases analyzed in the central laboratory after transport via PTS, compared with mean TAT of 4.5 minutes for samples analyzed in satellite laboratory. A major advantage of central laboratory testing is financial savings.
The unit cost of blood gas analysis in the satellite laboratory at Brigham and Women’s hospital was USD 8.98 at the time of the study, compared with USD 3.54 in the central laboratory.
There may, arguably, be additional advantages in terms of quality of service associated with centralizing blood gas analysis in a laboratory environment, where analytical expertise is concentrated.
Any logistic, operational or financial advantages of using PTS for transport of blood gases can only be realized if it can be established that transport via PTS has no effect on the measured parameters of blood gas analysis: pH, pCO2 and pO2.
A number of published studies, mostly emanating from the US, have addressed this issue over the past 30 years or so. In general, they have concluded that PTS does not affect pH or pCO2 but may affect, or even invalidate pO2 results, although there remains no consensus on this last point.
Early studies
The first published study [4] to examine the feasibility of transporting blood samples via PTS was conducted at the University of California Medical Center in 1963. The main finding of this small study, involving just 18 samples, was that most routinely measured chemical analytes were unaffected by PTS.
However, there was evidence of red cell destruction (hemolysis) in all samples, presumed to be the result of the rapid acceleration and deceleration associated with PTS.
Thus blood plasma analytes which are sensitive to hemolysis (potassium, phosphorous, lactate dehydrogenase) were shown to be artefactually raised by PTS.
Two much larger studies [5,6] confirmed that PTS damages blood cells, but also showed that the extent of hemolysis is a function of the speed and distance samples move through the PTS system and the number of switches (changes of direction) that the samples have to endure.
Hemolysis was also shown to be greater if sample tubes were only partially filled with blood. By the early 1970s it had become clear that the potential problem of hemolysis was system dependent.
In systems where blood was transported slowly, over a relatively short distance, and where every effort was made to ensure that sample bottles were filled, hemolysis was much reduced and often insufficient to have any clinically important effect on results.
A 1995 study detected no increased hemolysis in 291 samples transported via PTS [7]. The feasibility of transporting blood for routine biochemical analysis via PTS had been confirmed by this time, and its use for transport of samples for routine biochemical as well as hematology testing had already been successfully adopted [8,9].
The first study to examine the effect of PTS on blood gas analysis was published in 1971 [6]. This was part of a much larger study conducted at the Mayo Clinic investigating the effect of PTS on a range of routine biochemistry tests.
For the blood gas part of the study, duplicate venous blood samples were taken into heparinized Vacutainer tubes from an undisclosed number of subjects. The first duplicate was placed on crushed ice and retained within the laboratory.
The second was placed on crushed ice and transported by PTS prior to analysis. Both pH and pCO2 values were unaffected by transport via PTS.
There was, however, a small but consistent increase in pO2 following transport via PTS, so that the mean pO2 of the samples transported via PTS was 3.94 kPa (29.6 mmHg), significantly higher than the mean of 3.71 kPa (27.8 mmHg) for samples retained in the laboratory.
The difference between individual duplicates ranged from +0.06 to +0.60 kPa (+0.45 to + 4.5 mmHg). The authors of this study acknowledged that they had no explanation for the apparent increase in pO2 in samples transported via PTS.
Three subsequent studies [10,11,9] also demonstrated that pH and pCO2 were unaffected by transport via PTS, but all failed to demonstrate the positive bias in pO2 results that had been noted in venous samples transported via PTS in the Mayo Clinic study.
The consensus finding of the three studies was that pH, pCO2 and pO2 were all unaffected by PTS transport. It is worth noting that the PTS system in the Mayo Clinic study involved samples being transported over much longer distance (1,423 meters) and at significantly greater speed (9.75 m/sec) than was the case in the other three studies.
For example, in one of the studies [9] the maximum distance samples traveled by PTS was just 380 meters and speed was 7.6 m/sec.
By the early 1990s the balance of published evidence favored the view that PTS had no effect on blood gas analysis.
Whilst all studies before and since [12,13] have confirmed that both pH and pCO2 are unaffected by PTS, research over the past decade has reignited concern about the validity of pO2 measurement in PTS transported samples.
Focusing on pO2
The impetus for a fresh focus on the effect that PTS has on pO2 came from laboratory staff at the Mayo Clinic where, in the early 1990s, a dedicated laboratory PTS (not the system studied in the 1970s) was being evaluated for possible transport of specimens for blood gas analysis.
They noted some ‘unexpectedly high’ oxygen tensions in samples sent via PTS and suspected that these occasional high values might be due to the presence of air bubbles in the samples. By this time it had been demonstrated that the presence of air bubbles, introduced during arterial blood sampling, can artefactually increase pO2 and decrease pCO2 [14,15].
These changes are the result of equilibration between blood and contaminating ambient air, the latter having, relative to arterial blood, a high pO2 (approx. 20.0 kPa / 150 mmHg) and low pCO2 (approx. 0.04 kPa / 0.3 mmHg).
This equilibration phenomenon provided the rationale for the now universally recommended practice of expelling all air bubbles and capping syringes immediately after blood has been sampled for blood gases.
The Mayo Clinic staff hypothesized that the undesired effect of air bubbles on pO2 and pCO2 is enhanced by the inevitable increased agitation of samples that occurs during transport via PTS.
They designed a study [16] to test this hypothesis using samples of patients' arterial blood which were left over after routine blood gas analysis.
Forty, 4-mL pooled samples were collected. Each was subdivided into two identical 2-mL aliquots, contained in 3-mL syringes. Careful attention was made to remove all air bubbles and syringes were capped. One of the duplicate 2-mL aliquots (the control) was immediately carried on ice by a technician to the central laboratory for immediate analysis.
The second of each pair was assigned to one of four treatment groups (10 specimens per group). The first group was transported on ice by hand to the laboratory (manual transport group).
The second set had 0.2 mL air added using a tuberculin syringe, prior to recapping and transporting on ice by hand to the laboratory (air bubble plus manual transport group). The third set of 10 specimens were transported on ice via PTS (PTS transport group) and the final group comprised 10 specimens to which a 0.2-mL air bubble was added prior to transport on ice via PTS (air bubble plus PTS transport group).
Immediately these test samples were received in the laboratory, they were analyzed using the same analyzer used to analyze controls. The pO2 and pCO2 of each test sample and its control were compared.
The results for pO2 are summarized in Table I. The presence of an air bubble in a test sample was, as predicted from previous studies [14,15], associated with increased pO2, irrespective of the mode of transport. However, that increase was significantly greater in samples transported via PTS (mean increase, 7.7 kPa / 57.8 mmHg), than in those transported manually (mean increase, 2.8 kPa / 21 mmHg).
The mean pO2 of the 10 samples which had no air added and transported via PTS (17.0 kPa / 127.5 mmHg), was slightly but not significantly higher than the mean of their controls (16.7 kPa / 127 mmHg). The results of this study suggested that so long as all air is expelled from the syringe, PTS has no significant effect on pO2 values.
However, if an air bubble is present, the effect on pO2 is certainly significant, indeed far greater in samples transported via PTS than in samples transported manually. PTS was shown to have no effect on pCO2.
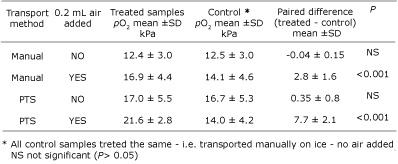
TABLE I: Effect of air bubble and
transportation method on pO2 (adapted from Ref.
16)
Comprehensive study
The main findings of the 1995 Mayo Clinic study were confirmed and refined a year later, with publication of what remains the most detailed and comprehensive examination of the effect PTS has on pO2, conducted by John Toffaletti and his team at the Duke University Medical Center, Durham, North Carolina [17].
This study was designed to both confirm the effect that the presence of contaminating air has on the pO2 of samples transported by PTS and investigate possible ways of minimizing that effect.
The team used blood tonometered to pO2 of 8.2, 10.0, 19.0 and 45.0 kPa (61.5, 75, 142.5, 337.5 mmHg) to examine the effect of PTS on pO2 across the range of oxygen tension seen in clinical practice. They also studied the blood of around 50 patients whose pO2 ranged from 6.1 kPa (45.8 mmHg) to 53 kPa (398 mmHg).
They tested the effect on pO2 of transport via PTS versus no transport for a variety of conditions including: with and without air bubbles of varying size; with and without an additional liner designed to minimize agitation during PTS; transport at room temperature, and on ice.
They also tested the effect of reducing the speed at which samples are transported via PTS.
The results of this study confirm that the presence of contaminating air in a sample of arterial blood affects the pO2, and the magnitude of that effect is greatly increased if samples are transported by PTS.
The magnitude and direction of change (i.e. negative or positive bias) is crucially dependent on pO2 tension.
If pO2 tension of blood is around the same as that of ambient air (20 kPa / 150 mmHg), PTS has no effect on pO2. For specimens whose pO2 is less that 20 kPa (150 mmHg), PTS is associated with a positive bias and for specimens with pO2 greater than 20 kPa (150 mmHg), a negative bias.
The magnitude of the bias, whether negative or positive, correlates positively with the volume of contaminating air (see Fig. 1).
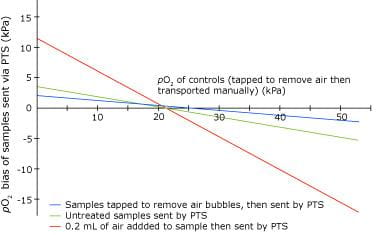
FIG. 1: pO2 bias that
results from PTS -best fit lines, each derived from analysis of 20
samples (pO2 range 8.0-50 kPa) (adapted
from ref. 17)
The presence of extra liners in the PTS sample carrier to minimize movement of the sample during transit was found to have no effect on pO2. Sending samples via PTS on ice rather than at room temperature had no protective effect against the effects of PTS on pO2 for tonometered blood whose pO2 was 10.6 kPa (79.5 mmHg), but protected against the PTS effect in samples with very high pO2 (45 kPa / 337.5 mmHg).
Halving the speed at which samples travel through PTS from 7.7 m/sec to 3.8 m/sec was shown to be highly effective in reducing (almost eliminating) the effect that PTS has on pO2.
A protocol aimed at removing contaminating air from samples (Table II) was applied in a study of 10 hypoxemic patients (pO2 range, 6.1-10.7 kPa / 45.8 - 80.3 mmHg). PTS increased pO2 by a mean of just 0.3 ±0.78 kPa (2.3 ± 5.8 mmHg) for samples treated as per the protocol, compared with a mean increase of 1.8 ± 1.6 kPa ( 13.5 ± 12.0 mmHg) for untreated samples and a mean increase of 4.1 ± 2.5 kPa (30.7 ± 18.6 mmHg) for samples to which 0.2 mL of air had been added.
|
TABLE II: Procedure recommended to remove air bubbles from arterial blood sample [17]
Recent studies
The findings of the Mayo Clinic and Duke University Medical Center study have shown that the bias in pO2 observed in samples sent via PTS is due to the presence of contaminating air in the sample.
Adoption of a protocol to eliminate air bubbles from samples has the effect of significantly reducing that bias to a level which is clinically acceptable. Two recent studies [12,18] confirm these findings.
It is clearly essential that for PTS to be used for transport of blood gases, a rigorous protocol for removal of air, including that present in the dead space of a syringe, must be adopted. As Toffaletti and his team observed, such a protocol is not always 100 % successful in eliminating air from samples.
Furthermore, there is evidence [12] that such rigorous protocols are not always applied by busy doctors, especially in an emergency setting.
Some argue that because the removal of contaminating air cannot always be guaranteed, and the pO2 bias that results from contaminating air is so great, PTS should not be used for blood gases [12,18], whereas others, including Toffaletti, feel that so long as both clinical and laboratory staff are well educated about the necessity for rigorous care in the processing of samples, PTS provides an acceptable means of transport for blood gas specimens.
PTS – the pressure effect
A possible solution to the problem is suggested by the results of a study conducted in 2001 at St George’s Hospital, London [13]. The effects of PTS on pO2 have been assumed to be the result of the increased agitation of samples that occurs during transport.
However, increased packing of the sample to reduce that agitation, fails to have any effect [17]. The team at St George’s designed their study to test the hypothesis that the effect of PTS on pO2 is due not to agitation of samples but rather the pressure changes that samples are exposed to as they pass through the system.
Triplicate arterial samples for blood gas analysis were taken from forty ICU patients. The first of the triplicates (the control) was analyzed immediately in the unit. The other two samples were capped and sent via PTS to the laboratory.
The first of these was sent via PTS in the conventional canister and the second was packed in a pressure-sealed container before being sent in the conventional canister via PTS.
All samples sent via PTS were analyzed immediately they were received in the laboratory.
The pO2 of samples sent via PTS in the conventional canister was significantly higher than the pO2 of samples (controls) analyzed in ICU (median difference 1.5 kPa (11.25 mmHg), interquartile range of difference (IQR) 2.37, p = 0.0047), whereas the pO2 of samples sent in pressure-sealed conditions was not significantly different from the pO2 of controls analyzed in ICU (median difference 0.74 kPa / 5.6 mmHg, IQR 1.643, p = 0.2987).
This unconfirmed work has highlighted for the first time the significance of the pressure changes that blood samples are exposed to during PTS and provided a means of minimizing the effect that PTS has on pO2.
The authors conclude that samples for blood gases should not be transported via PTS, unless samples are transported in a pressure-tight system.
SUMMARY
The validity of using PTS to transport samples for blood gas analysis has been tested in a number of studies over 30 years. The main findings are:
- PTS has no effect on pH or pCO2 [6, 9,10,11,12,13]
- PTS does not affect pO2 so long as pO2 is close to that of ambient air (20 kPa / 150 mmHg) [17]
- PTS can cause an increase in pO2 for samples whose pO2 is less that 20 kPa (150 mmHg) and a decrease in pO2 for samples whose pO2 is greater than 20 kPa (150 mmHg) [17]
- The main cause of the change in pO2 induced by PTS is contaminating air [15,17]
- Clinically significant aberrant pO2 results can occur if samples are not purged of air before transport via PTS [17,12,18]
- If air could be reliably excluded from an arterial sample before transport, the changes in pO2 induced by PTS would be clinically insignificant [12,17,18]
- Protocols aimed at purging air from arterial specimens are neither 100 % effective nor universally applied [12,13,17]
- The effect of PTS on pO2 values can be ameliorated by reducing the speed at which samples are sent via PTS [17] and by sending samples in pressure-sealed containers [13].
Although PTS has been widely used for the transport of specimens to the laboratory for more than 25 years, there remains no consensus about the advisability of using PTS to transport samples for blood gas analysis.
There is, however, consensus that where PTS systems are used, every effort must be made to ensure that protocols for the elimination of air from arterial blood specimens, prior to transport, are as effective as possible and rigorously enforced.
The use of pressure-sealed containers warrants further investigation.
References+ View more
- Kirchoff C. Reducing turnaround times for blood gas testing improves patient care. www.ilus.com/docs/Carol_Kirchoff_Case.pdf, 2004
- Cox CJ. Acute care testing. Blood gases and electrolytes at the point of care. Clin Lab Med 2001; 2: 321-25
- Winkelman J, Wybenga G. Quantification of medical and operational factors determining central versus satellite laboratory testing of blood gases. Amer J Clin Pathol 1994; 102: 7-10
- McClellan EK, Nakamura R, Hass W et al. Effect of pneumatic tube transport system on the validity of determinations in blood chemistry. Amer J Clin Pathol 1964; 42: 152-55
- Delbruck A, Poschmann H. Über den Einfluss des Rohrposttransportes auf klinisches Untersuchungsmaterial unter verschiedenen Betriebsbedingungen. Z Klin Chem Klin Biochem 1968; 6: 211
- Steige H, Jones JD. Evaluation of pneumatic tube system for delivery of blood samples. Clinical Chemistry 1971; 17: 1160-64
- Stair TO, Howell JM, Fitzgerald DJ. Haemolysis of blood specimens transported from ED to laboratory by pneumatic tube. Amer J Emergency Medicine 1995; 35: 484
- Weaver DK, Miller D, Levanthal E, Tropeano V. Evaluation of a computer-directed pneumatic-tube system for pneumatic transport of blood specimens. Amer J Clin Pathol 1977; 70: 400-05.
- Keshgegian A, Bull G. Evaluation of a soft-handling computerized pneumatic tube specimen delivery system. Amer J Clin Pathol 1992; 97: 535-40
- Poznanski W, Smith F, Bodley F. Implementation of a pneumatic-tube system for transport of blood samples. Amer J Clin Pathol 1978; 70: 291-95
- Pragay D, Fan P, Brinkley S, Chilcote ME. A computer directed pneumatic tube system: its effect on specimens. Clin Biochem 1980; 13: 259-61
- Zaman Z, Demedts M. Blood gas analysis: POCT versus central laboratory on samples sent by a pneumatic tube system. Clin Chim Acta 2001; 307: 101-06
- Collinson P, John C, Gaze D, Ferrigan L, Cramp DJ. Changes in blood gas samples produced by a pneumatic tube system. Clin Pathol 2002; 55: 105-07
- Madeido G , Sciacca R, Hause L. Air bubbles and temperature effect on blood gas analysis. J. Clin Pathol 1980; 33: 864-67.
- Biswas C, Ramos J, Agroyannis B, Kerr D. Blood gas analysis: effect of air bubbles in syringe and delay in estimation. BMJ 1982; 284: 923-27
- McKane M, Southern P, Santrach P, Burrit M, Plevak D. Sending blood gas specimens through pressurised transport systems exaggerates the error in oxygen tension measurements created by the presence of air bubbles. Anesth Analg 1995; 81: 179-82
- Astles J, Lubarsky D, Loun B, Sedor F, Toffaletti J. Pneumatic transport exacerbates interference of room air contamination in blood gas samples. Arch Pathol Lab Med 1996; 120: 642-47
- Lu J-Y, Kao J-T, Chien T-I, Lee T-F, Tsai K-S. Effects of air bubbles and tube transportation on blood oxygen tension in arterial blood gas analysis. J Formos Med Assoc 2003; 102: 246-49.
References
- Kirchoff C. Reducing turnaround times for blood gas testing improves patient care. www.ilus.com/docs/Carol_Kirchoff_Case.pdf, 2004
- Cox CJ. Acute care testing. Blood gases and electrolytes at the point of care. Clin Lab Med 2001; 2: 321-25
- Winkelman J, Wybenga G. Quantification of medical and operational factors determining central versus satellite laboratory testing of blood gases. Amer J Clin Pathol 1994; 102: 7-10
- McClellan EK, Nakamura R, Hass W et al. Effect of pneumatic tube transport system on the validity of determinations in blood chemistry. Amer J Clin Pathol 1964; 42: 152-55
- Delbruck A, Poschmann H. Über den Einfluss des Rohrposttransportes auf klinisches Untersuchungsmaterial unter verschiedenen Betriebsbedingungen. Z Klin Chem Klin Biochem 1968; 6: 211
- Steige H, Jones JD. Evaluation of pneumatic tube system for delivery of blood samples. Clinical Chemistry 1971; 17: 1160-64
- Stair TO, Howell JM, Fitzgerald DJ. Haemolysis of blood specimens transported from ED to laboratory by pneumatic tube. Amer J Emergency Medicine 1995; 35: 484
- Weaver DK, Miller D, Levanthal E, Tropeano V. Evaluation of a computer-directed pneumatic-tube system for pneumatic transport of blood specimens. Amer J Clin Pathol 1977; 70: 400-05.
- Keshgegian A, Bull G. Evaluation of a soft-handling computerized pneumatic tube specimen delivery system. Amer J Clin Pathol 1992; 97: 535-40
- Poznanski W, Smith F, Bodley F. Implementation of a pneumatic-tube system for transport of blood samples. Amer J Clin Pathol 1978; 70: 291-95
- Pragay D, Fan P, Brinkley S, Chilcote ME. A computer directed pneumatic tube system: its effect on specimens. Clin Biochem 1980; 13: 259-61
- Zaman Z, Demedts M. Blood gas analysis: POCT versus central laboratory on samples sent by a pneumatic tube system. Clin Chim Acta 2001; 307: 101-06
- Collinson P, John C, Gaze D, Ferrigan L, Cramp DJ. Changes in blood gas samples produced by a pneumatic tube system. Clin Pathol 2002; 55: 105-07
- Madeido G , Sciacca R, Hause L. Air bubbles and temperature effect on blood gas analysis. J. Clin Pathol 1980; 33: 864-67.
- Biswas C, Ramos J, Agroyannis B, Kerr D. Blood gas analysis: effect of air bubbles in syringe and delay in estimation. BMJ 1982; 284: 923-27
- McKane M, Southern P, Santrach P, Burrit M, Plevak D. Sending blood gas specimens through pressurised transport systems exaggerates the error in oxygen tension measurements created by the presence of air bubbles. Anesth Analg 1995; 81: 179-82
- Astles J, Lubarsky D, Loun B, Sedor F, Toffaletti J. Pneumatic transport exacerbates interference of room air contamination in blood gas samples. Arch Pathol Lab Med 1996; 120: 642-47
- Lu J-Y, Kao J-T, Chien T-I, Lee T-F, Tsai K-S. Effects of air bubbles and tube transportation on blood oxygen tension in arterial blood gas analysis. J Formos Med Assoc 2003; 102: 246-49.
May contain information that is not supported by performance and intended use claims of Radiometer's products. See also Legal info.


Acute care testing handbook
Get the acute care testing handbook
Your practical guide to critical parameters in acute care testing.
Download now
Related webinar
Evolution of blood gas testing Part 1
Presented by Ellis Jacobs, PhD, Assoc. Professor of Pathology, NYU School of Medicine.
Watch the webinar