Printed from acutecaretesting.org
January 2003
The use of capability index for running and monitoring quality control
The assessment of analytical performance using quality control (QC) has been a fundamental part of laboratory practice for over 50 years.
However, in recent years, the way this is performed has changed such that the assessment is not only concerned with statistical analyses, but is part of the laboratory's quality system and related to patient care and satisfaction.
In addition, the experience gained in quality improvement in the manufacturing and service industries has been incorporated into a number of quality assessment systems.
Traditionally, statistical QC is monitored using the mean (x̄) and standard deviation (s) obtained from repeated measurements with a particular analytical method on known specimens or QC materials.
Generally, if the method is in control, initial values can be calculated on five measurements per day carried out over five days. A number of different calibrations or standard curves should be included in these determinations. Once the values have been established and the control material put into routine use, the values should be reviewed monthly.
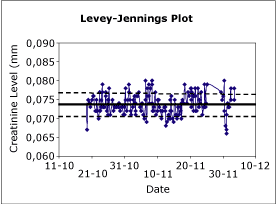 |
Fig. 1. Levey-Jennings plot shoving the mean and the 1s and 2s limits. |
The most common method for recording and observing QC is to use control charts which show the observed result in comparison with the distribution of past observations (Fig. 1).
The distribution is shown by a central line representing the mean and then limits calculated from the standard deviation, creating a chart commonly known as a Levey-Jennings chart. If the error distribution of the method is assumed to be Gaussian, the control limits are normally set as the mean ± 2s or 3s. The 2s limit represents the 95 percentile of the data and the 3s limit, the 99.7 percentile.
A value outside the 2s limit should occur once in 20 observations and outside the 3s limit, three times in 1,000 observations. If a value is outside the 3s limit, the observation is normally considered suspect, suggesting something may have occurred to the analytical method.
With the advent of stable, commercial QC materials, a more comprehensive analysis of control data can be performed using the multirule procedure developed by Westgard and co-workers [1-3]
These refinements allow a better understanding of the performance characteristics of the analytical procedure. Multirule QC uses a combination of decision criteria, or control rules, to determine whether an analytical run is in-control or out-of-control.
The Westgard multirule QC procedure incorporates five different control rules to judge the acceptability of an analytical run which are designed for increased error detection and reduced false rejections.
The rules are as follows:
- 13s - refers to a control rule that is commonly used with a Levey-Jennings chart when the control limits are set as the mean plus 3s and the mean minus 3s. A run is rejected when a single control measurement exceeds the mean plus 3s or the mean minus 3s control limit.
- 22s - reject when two consecutive control measurements, on the same side of the mean, exceed the mean plus or minus 2s.
- R4s - reject when the difference between two consecutive control points exceeds 4s.
- 41s - reject when four consecutive control measurements, on the same side of the mean, exceed the mean plus or minus 1s.
- 10x - reject when 10 consecutive control measurements fall on one side of the mean.
If the run has been rejected, the problem obviously must be investigated and corrected. The laboratory also needs to develop a policy on how to manage patient results between the last acceptable QC and the failed QC.
In our laboratory, we tailor the control algorithm for individual assays based on the capability of the analyte [4] and use a combination of assay capability and the multirules to monitor analytical performance. We have also adopted six sigma as the goal for performance acceptability.
The concept of six sigma was developed in industry as a process improvement tool [5-7]. Industry uses six sigma as a funneling tool, or a methodology for drilling down into the process, sorting through the complexity of the process and finding those vital few factors that need to be controlled.
Basically, the concept is that six sigma (this is equivalent to 6s) should fit within the tolerance limit of the process. Many leading international companies have adopted the concept and have shown they have increased efficiency and profitability.
Six sigma, in fact, means that the performance of the process has achieved a level of 99.9997 %. One reason for the adoption of six sigma in healthcare is that although the reported laboratory error rate of five incorrect results per 1,000 tests seems commendable and is one tenth that of clinical healthcare overall, it is also 10 to 100 times greater than is tolerated in almost any other industry.
There is much room for improvement. It is now clear that healthcare, and especially pathology, is capable of achieving a six-sigma level of quality.
Process capability is a term used in industry to quantify the relationship between tolerance and the measured process performance. Various indices have been used with the most common being
Cpk = ALE - bias
6sd
If this concept is used in healthcare QC, the bias should be zero and thus the equation becomes
Cps = ALE
6s
where Cps is the capability index and ALE is the Allowable Limits of Error. Our laboratory uses the ALEs of the Royal College of Pathologists of Australasia (RCPA) and the Australasian Association of Clinical Biochemists (AACB) Chemical Pathology Group Quality Assurance Program (QAP).
The ALEs are expressed either as ±concentration or as ±percentage for each analyte from the target value. Some analytes have constant ALE at low concentrations, with proportional ALE for higher analyte ranges. The ALEs have been developed from both clinical and analytical requirements.
In terms of capability index, the performance of an assay can be considered as follows:
- If Cps < 4, the assay is incapable
- If 4 < Cps < 6, the assay is capable
- If Cps > 6, assay is highly capable (world class)
From the capability index of individual analytes, the appropriate multirule algorithm set and the number of QC samples that should be analyzed can be selected to maximize error detection and minimize false rejection.
Case 1: Two levels of QC (e.g. normal and abnormal)
|
Cps |
Standard |
Algorithm |
QC |
Runs |
|
>= 6 |
ALE/6 |
1 3s |
2 |
1 |
|
>= 4 and < 6 |
ALE/4 |
Full Westgard algorithm |
2 |
1 |
|
< 4 |
Monthly SD |
Full Westgard algorithm |
2 |
2 |
Case 2: Three levels of QC (e.g. some immunoassays)
|
Cps |
Standard |
Algorithm |
QC |
Runs |
|
>= 6 |
ALE/6 |
1 3s |
3 |
1 |
|
>= 4 and < 6 |
ALE/4 |
Full Westgard algorithm |
3 |
1 |
|
< 4 |
Monthly SD |
Full Westgard algorithm |
3 |
1 |
How does our laboratory monitor the analyte capability?
Every month, the QC summary is downloaded from the LIS and the Cps for each analyte determined using the RCPA/AACB ALEs. The capability index can then be used to classify the assay performance as shown above.
If there is a change in the capability index of the assay, we make the appropriate changes to the number of QC runs or the algorithm being used.
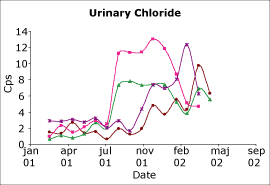 |
Fig. 2. The capability index urinary chloride on a biochemistry analyzer. Four different QC levels. |
In addition to being able to adjust, on a monthly basis based on performance, the most appropriate way to control an assay, the capability index is also used to monitor long-term performance of the analyte. This is simply done by plotting the Cps on a monthly basis.
Two examples are shown in Figs. 2 and 3. The results shown in Fig. 2 are for urinary chloride on a biochemistry analyzer. As can be seen, prior to July 2001 the assay was incapable.
However, in July our laboratory had the opportunity to evaluate a new series of chloride electrodes for this analyzer. It can be seen that there was an immediate improvement and that this improved performance has continued.
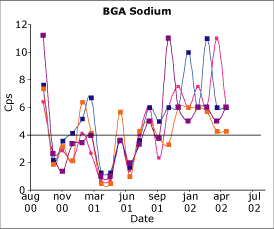 |
Fig. 3. The capability index of sodium on a blood gas analyzer. Four different QC levels. |
The results in Fig. 3 are for four levels of sodium QC on a blood gas analyzer. Up to the middle of 2001, the performance of this assay was very inconsistent with significant periods when it appeared to be incapable.
Then around August 2001, the manufacturers recommended a change in procedure in which the reference membrane be changed monthly instead of every three months on analyzers running more than 70 samples per day. This simple change has resulted in the improvement shown in the graph such that this is now a capable assay.
What are the advantages of using capability index?
In our laboratory, we have used the capability index to target assays that need attention, i.e., concentrate our efforts on those that have a capability index < 4. This has led to an improvement in our performance as measured by participation in external quality assessment schemes.
We have also been able to decide much more readily whether we can achieve improvements in poorly performing assays or, if the capability remains below acceptable levels, whether the laboratory should change the method.
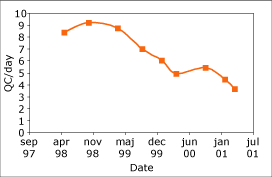 |
Fig. 4. Reduction in the amount of quality control runs per day with the introduction of a QC procedure based on capability index. |
The introduction of these procedures have had a major effect on the way we have needed to use quality control material, and Fig. 4 shows the reduction in the number of QCs run in the laboratory as we have developed these procedures in the laboratory.
In conclusion, by taking a lead from industry and incorporating quality control into the laboratory quality improvement system, it is possible to improve performance in a way that is both beneficial to the patient as well as cost-effective for the laboratory.
References+ View more
- Westgard JO, Groth T. Power function graphs for statistical control rules. Clin Chem 1979;25:863-869.
- Westgard JO, Barry PL, Hunt MR, Groth T. A multi-rule Shewart chart for quality control in clinical chemistry. Clin Chem 1981;27:493-501.
- Westgard JO. Multirule and "Westgard rules": What are they?
http://www.westgard.com/mltirule.htm- Chesher D, Burnett L. Equivalence of critical error calculations and process capability index Cpk. Clin Chem 1997;43:1100-1101.
- Westgard JO. Six Sigma Quality Design & Control. Desirable precision and requisite QC for laboratory measurement processes. Westgard QC, Inc, 296 pages. ISBN 1-886958-16-5.
- Nevalainen D, Berte L, Kraft C, Leigh E, Picaso L, Morgan T. Evaluating laboratory performance on quality indicators with the six sigma scale. Arch Pathol Lab Med 2000;124:516-519.
- Barry R, Murcko A, Brubaker C. The Six Sigma Book for Healthcare: Improving Outcomes by Reducing Errors. Quality Press, 735 pages. ISBN 156793191X.
References
- Westgard JO, Groth T. Power function graphs for statistical control rules. Clin Chem 1979;25:863-869.
- Westgard JO, Barry PL, Hunt MR, Groth T. A multi-rule Shewart chart for quality control in clinical chemistry. Clin Chem 1981;27:493-501.
- Westgard JO. Multirule and "Westgard rules": What are they?
http://www.westgard.com/mltirule.htm- Chesher D, Burnett L. Equivalence of critical error calculations and process capability index Cpk. Clin Chem 1997;43:1100-1101.
- Westgard JO. Six Sigma Quality Design & Control. Desirable precision and requisite QC for laboratory measurement processes. Westgard QC, Inc, 296 pages. ISBN 1-886958-16-5.
- Nevalainen D, Berte L, Kraft C, Leigh E, Picaso L, Morgan T. Evaluating laboratory performance on quality indicators with the six sigma scale. Arch Pathol Lab Med 2000;124:516-519.
- Barry R, Murcko A, Brubaker C. The Six Sigma Book for Healthcare: Improving Outcomes by Reducing Errors. Quality Press, 735 pages. ISBN 156793191X.
May contain information that is not supported by performance and intended use claims of Radiometer's products. See also Legal info.
Acute care testing handbook
Get the acute care testing handbook
Your practical guide to critical parameters in acute care testing.
Download nowScientific webinars
Check out the list of webinars
Radiometer and acutecaretesting.org present free educational webinars on topics surrounding acute care testing presented by international experts.
Go to webinars


