Printed from acutecaretesting.org
February 2018
Reference intervals and percentiles – implications for the healthy patient


Abbreviations and definitions
|
CKMB |
Creatine kinase MB isoform |
|
FN |
False negative – a negative test result in a person with disease. |
|
FP |
False positive – a positive test result in a person without disease. |
|
LoD |
Limit of detection. |
|
Percentile |
Each of the 100 equal groups into which a population can be divided according to the distribution of values of a particular variable. |
|
Sensitivity |
Fraction of persons with disease who get a positive test result with the assay in question. |
|
Specificity |
Fraction of persons without disease who get a negative test result with the assay in question. |
|
TN |
True negative – a negative test result in a person without disease. |
|
TP |
True positive – a positive test result in a person with disease. |
Background
When you perform a diagnostic biochemical test in a patient, you will compare the patient result to a reference interval or to a medical decision limit.
To determine a reference interval you need to test a large number of healthy people, the reference population. Health is a relative condition lacking a universal definition. Before collecting samples for making a reference interval, inclusion and exclusion criteria for participation have to be established. Furthermore, samples must be collected in a way that minimizes the risk of preanalytical errors.
The reference interval for a biochemical analyte is usually the central interval of values bounded by the reference limit values at certain designated percentiles [1,2].
That is, the reference interval refers to that interval set of values observed in the reference sample group or predicted for the reference population, defined by a specific percentage.
Distribution of test results from healthy populations
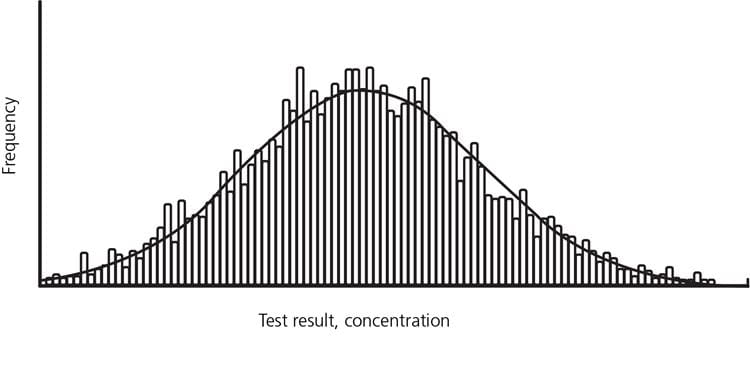
The results may be shown in a histogram or its normal curve overlay.
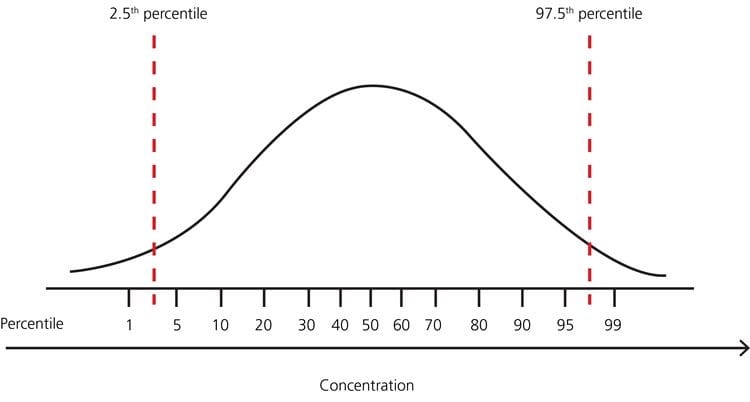
As mentioned above, the reference interval refers to an interval set of values observed in the reference sample group or predicted for the reference population, defined by a specific percentage [1].
The most commonly used definition of the reference interval is the interval of values containing the central 95 % of a healthy population, i.e. the reference limits are the values at the 2.5th and 97.5th percentiles, respectively. It means that any patient result within the interval from the 2.5th to the 97.5th percentile is per definition considered “normal” and any patient result outside this interval is per definition considered “not normal”.
In cases where the distribution is nonparametric (not normal distribution), the percentiles can still be used as limits as in Fig. 3
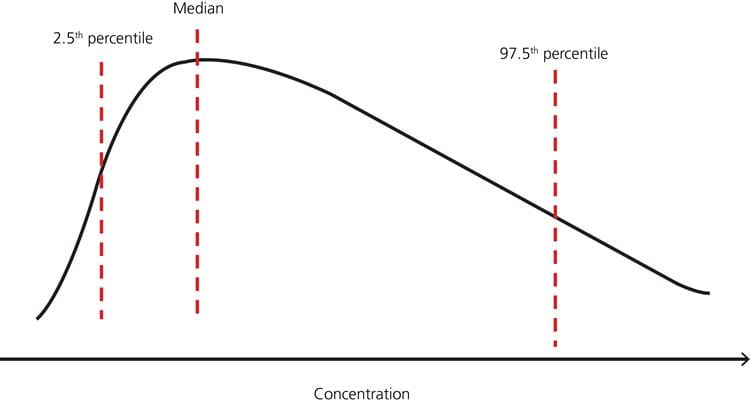
FIG. 3: Example – nonparametric distribution of test results in a healthy population with reference limits 2.5th and 97.5th percentiles, respectively (adapted from [7]).
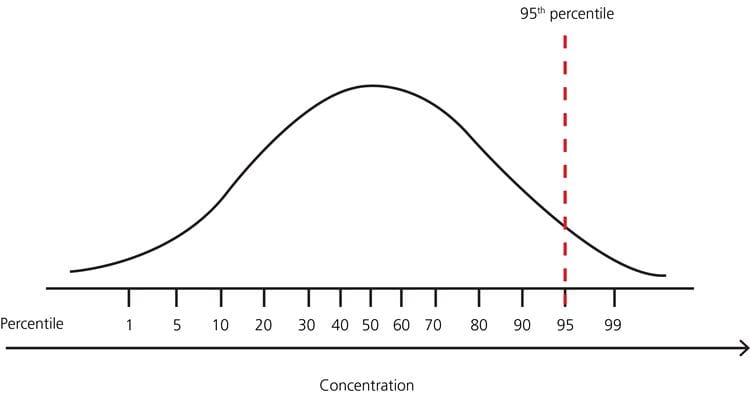
FIG. 4: Example – distribution of test results in a healthy population with no lower limit and upper limit 95th percentile
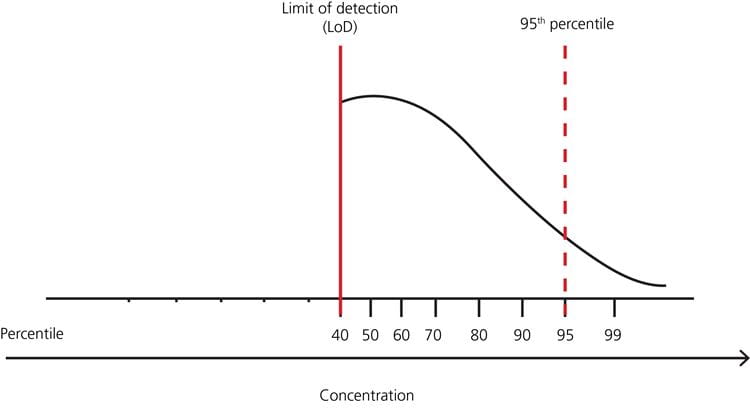
FIG. 5: Example – distribution of test results in a healthy population with no lower limit but many results below the limit of detection, and upper limit 95th percentile
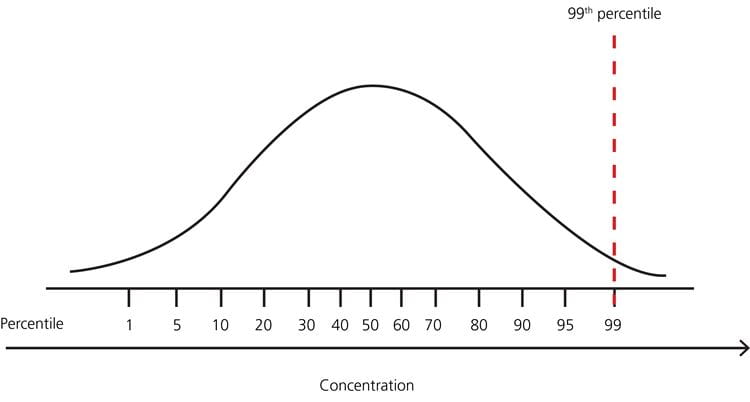
FIG. 6: Example – distribution of test results in a healthy population with no lower limit and upper limit 99th percentile
Why are extreme results eliminated from reference intervals?
Upper limits for these analytes can be lowered by further screening of the reference individuals; e.g. for troponin it has been shown that adding estimated glomerular filtration rate, NT-proBNP results and echocardiography for inclusion/exclusion can decrease the determined 99th percentile by approximately 50 % [6,7].
However, elimination of extreme results in reference interval studies by the use of more extensive screenings is expensive and therefore it might not be applied for economic reasons.
Implications of eliminating extreme results from reference intervals
The percentile used as cut-off determines the clinical sensitivity (fraction of patients with true-positive (TP) results in the sick group) and thereby the fraction of patients with false-negative (FN) results in the sick group. It also determines the clinical specificity (fraction of patients with true negative (TN) results in the healthy group) and thereby the fraction of patients with false positive (FP) results in the healthy group. The choice of percentile/cut-off is always a trade-off between sensitivity and specificity.
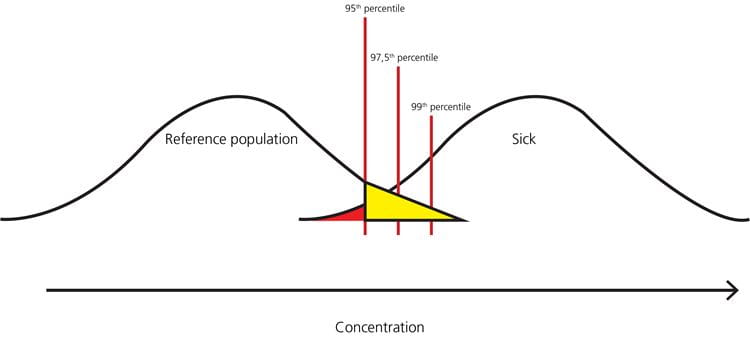
FIG. 8: Example – when the 95th percentile is the upper limit of the reference interval, the healthy persons in the yellow part of the distribution will get a false-positive result, and the sick persons in the red part of the distribution will get a false-negative result
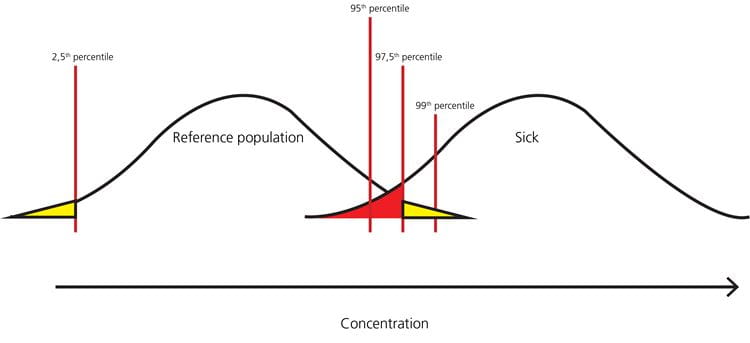
FIG. 9: Example – when the 2.5th percentile is the lower limit and the 97.5th percentile is the upper limit of the reference interval, the healthy persons in the yellow parts of the distribution will get a false-positive result, and the sick persons in the red part of the distribution will get a false-negative result

FIG. 10: Example – when the 99th percentile is the upper limit of the reference interval, the healthy persons in the yellow part of the distribution will get a false-positive result, and the sick persons in the red part of the distribution will get a false-negative result
As can be seen from Fig. 8, Fig. 9 and Fig. 10, the higher the upper percentile that is used for cut-off, the lower the number of healthy persons that will get a false-positive result. However, the higher the upper percentile that is used for cut-off, the higher the number of sick persons that will get a false-negative result.
Usually we want to have as high a clinical sensitivity as possible, meaning that we will prefer a lower cut-off to avoid missing a diagnosis in a sick patient and paying the price of increasing the number of healthy persons who get a false-positive result.
• All the results either far from or around the reference limits are only punctual representation of the biological variation
• The analytical imprecision will have an influence on the actual results
If two tests are ordered, the probability that the second test is ≤95th percentile is also 95 %, but the probability that this is the case for both tests is 0.9052 = 0.90 ~90 %. If 10 tests are ordered, which often occur, the probability that all are ≤95th percentiles is 0.60 ~60 % [10].
• Not all results outside the cut-offs mean that the patient is sick
• If the patient is not sick, it does not mean that a result outside the cut-offs is wrong.
References+ View more
- CLSI. Defining, Establishing, and Verifying Reference Intervals in the Clinical Laboratory; Approved Guideline – Third Edition. CLSI document EP28-A3c. Wayne, PA: Clinical and Laboratory Standards Institute; 2008. Corrected version October 2010
Higgins C. An introduction to reference intervals (1) - some theoretical considerations. www.acutecaretesting.org Jan 2010. https://acutecaretesting.org/en/articles/an-introduction-to-reference-intervals-1--some-theoretical-considerations
- Thygesen K, Alpert JS, Jaffe AS, et al. Third universal definition of myocardial infarction. J Am Coll Cardiol 2012; 60: 1581–598.
- Horn PS, Pesce, AJ. Reference intervals: an update. Review. Clin Chim Acta 2003; 334: 5-23
- Hickman PE, Lindahl B, Potter JM et al. Is it time to do away with the 99th percentile for cardiac troponin in the diagnosis of acute coronary syndrome and the assessment of cardiac risk? Clin Chem 2014; 60(5): 734-736
- Collinson PO, Heung YM, Gaze D, et al. Influence of population selection on the 99th percentile reference value for cardiac troponin assays. Clin Chem 2012; 58: 219 –225
- Koerbin G, Abhayaratna WP, Potter JM, et al. Effect of population selection on 99th percentile values for a high sensitivity cardiac troponin I and T assays. Clin Biochem 2013; 46: 1636–643
- Guidi GC, Lippi G, Solero GP, et al. Managing transferability of laboratory data. Review. Clin Chim Acta 2006; 374(1-2): 57-62
- Guidi GC, Salvagno GL. Reference intervals as a tool for total quality management. Special issue: Quality in laboratory diagnostics: from theory to practice. Biochemia Medica 2010; 20(2): 165-172
- Islin H. Interpretation of laboratory results. www.acutecaretesting.org Jan 2010. https://acutecaretesting.org/en/articles/interpretation-of-laboratory-results
References
- CLSI. Defining, Establishing, and Verifying Reference Intervals in the Clinical Laboratory; Approved Guideline – Third Edition. CLSI document EP28-A3c. Wayne, PA: Clinical and Laboratory Standards Institute; 2008. Corrected version October 2010
Higgins C. An introduction to reference intervals (1) - some theoretical considerations. www.acutecaretesting.org Jan 2010. https://acutecaretesting.org/en/articles/an-introduction-to-reference-intervals-1--some-theoretical-considerations
- Thygesen K, Alpert JS, Jaffe AS, et al. Third universal definition of myocardial infarction. J Am Coll Cardiol 2012; 60: 1581–598.
- Horn PS, Pesce, AJ. Reference intervals: an update. Review. Clin Chim Acta 2003; 334: 5-23
- Hickman PE, Lindahl B, Potter JM et al. Is it time to do away with the 99th percentile for cardiac troponin in the diagnosis of acute coronary syndrome and the assessment of cardiac risk? Clin Chem 2014; 60(5): 734-736
- Collinson PO, Heung YM, Gaze D, et al. Influence of population selection on the 99th percentile reference value for cardiac troponin assays. Clin Chem 2012; 58: 219 –225
- Koerbin G, Abhayaratna WP, Potter JM, et al. Effect of population selection on 99th percentile values for a high sensitivity cardiac troponin I and T assays. Clin Biochem 2013; 46: 1636–643
- Guidi GC, Lippi G, Solero GP, et al. Managing transferability of laboratory data. Review. Clin Chim Acta 2006; 374(1-2): 57-62
- Guidi GC, Salvagno GL. Reference intervals as a tool for total quality management. Special issue: Quality in laboratory diagnostics: from theory to practice. Biochemia Medica 2010; 20(2): 165-172
- Islin H. Interpretation of laboratory results. www.acutecaretesting.org Jan 2010. https://acutecaretesting.org/en/articles/interpretation-of-laboratory-results
May contain information that is not supported by performance and intended use claims of Radiometer's products. See also Legal info.


Acute care testing handbook
Get the acute care testing handbook
Your practical guide to critical parameters in acute care testing.
Download now
Scientific webinars
Check out the list of webinars
Radiometer and acutecaretesting.org present free educational webinars on topics surrounding acute care testing presented by international experts.
Go to webinars