Printed from acutecaretesting.org
June 2004
To co-ox or not to co-ox


History
The study of blood oxygen saturation has its roots in early hot-air and hydrogen balloon flights made in France during the 1800s [1]. Balloon crews noticed ill-effects when their balloons rose over 7,000 meters.
On April 15, 1875, the balloon Zenith ascended to an altitude of 8,600 meters with a crew of three. Without warning, their arms and legs were paralyzed and two of them perished. The tragedy was regarded as a national catastrophe and they were commemorated as “martyrs to science in the search for truth”.
The cause of the catastrophe was revealed in 1878 following the publication of La Pression Barometrique by the French scientist Paul Bert. This book reviewed the physiological symptoms of animals and humans subjected to low barometric pressures.
It was Bert who first published simple curves representing the relation between the partial pressure of oxygen in air and the content of oxygen in the blood. This was the first in vivo dissociation curve. Bert was also the first to demonstrate that blood would absorb more oxygen when the temperature dropped.
In 1885, Christian Bohr of Copenhagen published a more refined dissociation curve for a hemoglobin solution (not whole blood) that looked like a hyperbola. In 1903, Bohr discovered the s-shaped dissociation curve for whole blood (Fig. 1).
In the following year, Bohr and colleagues demonstrated that the position of the dissociation curve was influenced by the amount of carbon dioxide in the blood.
By 1910, Joseph Barcroft of Cambridge made the discovery that the dissociation of oxyhemoglobin was influenced by pH, ionic strength and temperature (Barcroft’s group also discovered the increased oxygen affinity of fetal hemoglobin much later, in the 1930s). These discoveries became pivotal in the study of respiration physiology.
A mathematical description of the oxyhemoglobin dissociation curve was first suggested by Archibald Hill in 1910. However, at that time the molecular weight of hemoglobin was not known and there were different opinions as to how the equation should be interpreted. It was not until 1979 that John Severinghaus suggested a modified equation that better fits the experimental data:
sO2 = ([pO2 + 150 × pO2)-1 × 23,400] +1)-1
FIG. 1. Oxygen-hemoglobin dissociation curve and factors that shift the curve right or left. 2,3-DPG is 2,3-diphosphoglycerate, an organic compound normally present in erythrocytes that binds to hemoglobin and tends to reduce the affinity of hemoglobin for oxygen.
How to measure oxygen saturation
There are two basic ways to measure hemoglobin oxygen saturation in blood: (1) gasometrically and (2) spectrophotometrically.
Gasometric methods rely on the release, reaction and selected reabsorption of gases in a closed system. Standard gas laws are used to relate gas pressures to the oxygen fraction. The classic gasometric procedure is called the Van Slyke method [2]. The development of spectrophotometric methods dates back to Isaac Newton’s studies of light in the 1600s.
Work by Lambert (1760) and Beer (1852) resulted in the Beer-Lambert law that describes the transmission/absorption of light as a logarithmic function of the concentration of the absorbing molecules in solutions [3].
The first spectrophotometric measurements of blood were made in the 1930s. In the 1950s, a spectrophotometer was used for measuring hemoglobin and its derivatives. Specific instrumentation for measuring oxygen saturation was developed in the 1960s. The use of ear oximeters for continuous estimates of arterial saturation arose from aviation studies in both Germany and America during World War II. Widespread use of pulse oximeters developed in the 1980s.
An oximeter (frequently called a CO-Oximeter, the name of the first commercially popular device made by Instrumentation Laboratories) consists of a hemolyzer unit, a photo lamp, a lens system and sensing photodiodes.
Heating the blood sample to 37 °C and hemolyzing it with high-frequency vibrations produce a translucent solution. Incompletely hemolyzed red blood cells can scatter light and introduce measurement errors (there are some hemoximeters on the market that do not hemolyze the sample).
Light from the lamp is filtered and focused to pass through the blood sample. The transmitted light is then focused through a diffraction grating that separates the light into a continuous spectrum.
A mask then selects the specific wavelengths used for measurement. These individual wavelengths are directed onto photodiodes that produce electrical currents proportional to the light intensities.
The light intensities are dependent on the amount of light absorbed by the different concentrations and types of hemoglobin. Once the concentrations of the different types of hemoglobin are known, saturation can be calculated using the equations shown below.
SYMBOLS AND DEFINITIONS
Concentration of total hemoglobin
ctHb is the concentration (c) of total hemoglobin (tHb) in blood. Total hemoglobin, in principle, includes all types of hemoglobin:
- Hemoglobin (HbA) - normal adult hemoglobin is a complex protein containing iron and capable of transporting oxygen in the blood.
- Deoxyhemoglobin (HHb) - unoxygenated (formerly called “reduced”) hemoglobin.
- Oxyhemoglobin (O2Hb) - oxygenated hemoglobin, containing four molecules of oxygen per hemoglobin molecule.
- Carboxyhemoglobin (COHb) - hemoglobin bound to carbon monoxide, a bond about 210 times stronger than the oxygen-hemoglobin affinity; prevents normal transfer of oxygen and carbon dioxide in the blood.
- Methemoglobin (MetHb) - hemoglobin molecule whose iron is in the oxidized, ferric state; useless for respiration; found in the blood after poisoning with acetanilide, potassium chlorate and other substances.
- Sulfhemoglobin - hemoglobin in combination with sulphur. The very rare and non-oxygen-carrying sulfhemoglobin is not included in the reported ctHb.
- Fetal hemoglobin (HbF) - the major type of hemoglobin in the developing fetus. The oxygen dissociation curve for fetal hemoglobin is shifted to the left compared to adult hemoglobin.
The concentration of total hemoglobin may be expressed as:
ctHb = cO2Hb + cHHb + cCOHb + cMetHb
The systematic symbol for arterial blood is ctHb(a). The analyzer symbol may be tHb or ctHb.
Reference ranges
ctHb(a) reference range (adult):
- Male: 8.4-10.9 mmol/L (13.5-17.5 g/dL)
- Female: 7.4-9.9 mmol/L (12.0-16.0 g/dL)
Oxygen saturation
Definition
sO2 is oxygen saturation (sometimes called functional saturation) and is defined as the ratio between the concentrations of O2Hb and HHb + O2Hb:
![]()
sO2, as defined above, will immediately tell if more oxygen can be carried by hemoglobin – or whether an increase in pO2 will increase only the physically dissolved oxygen.
The systematic symbol for arterial blood is sO2(a). The analyzer symbol may be sO2.
Reference ranges
sO2(a) normal range (adult): 95-99 %
Hemoglobin fraction of total hemoglobin (fractional oxyhemoglobin)
Definition
FO2Hb is defined as the ratio between the concentrations of O2Hb and tHb (cO2Hb/ctHb). It is calculated as follows:
![]()
The systematic symbol for arterial blood is FO2Hb(a).
The analyzer symbol may be O2Hb or FO2Hb.
Reference ranges
FO2Hb(a) reference range (adult): 94-98 %
Oxygen tension at 50 % saturation of blood
Definition
p50 is the oxygen tension at half saturation (50 %) of blood and is calculated from the measured oxygen tension and oxygen saturation by extrapolation along the oxygen dissociation curve to 50 % saturation. The systematic symbol for p50 determined from arterial blood is p50(a). The analyzer symbol may be p50(act) or p50.
Reference ranges
p50(a) reference range (adult): 24-28 mmHg (3.2-3.8 kPa)
Measured saturation
An oximeter is a spectrophotometer designed to measure blood oxygen saturation. Each type of hemoglobin molecule (i.e., HHb, O2Hb, COHb and MetHb) has its own light absorption spectrum.
Oximeters contain light sources at selected wavelengths that correspond to the absorption spectra of the hemoglobin molecules to be measured. Thus, a basic oximeter that can measure sO2 needs to determine the absorption at only two wavelengths, one for HHb and one for O2Hb.
Pulse oximeters use two wavelengths that can be transmitted through the skin (e.g., a finger or toe), allowing non-invasive monitoring of saturation.
However, two-wavelength oximeters can give misleading estimates of the oxygen content of blood in the presence of elevated levels of COHb and MetHb.
To obtain FO2Hb, an oximeter must use at least four wavelengths (one each for HHb, O2Hb, COHb and MetHb). At present, such oximeters (sometimes called hemoximeters to distinguish them from pulse oximeters) require blood samples from the patient.
The relation between FO2Hb and sO2 is:
FO2Hb = sO2 × (1 - FCOHb - FMetHb)
It is important to know that “oxygen saturation”’ as measured by pulse oximeters is not FO2Hb, but sO2. The equation given above expresses the relationship between FO2Hb and sO2.
Thus, if no abnormal hemoglobins (dyshemoglobins) are present, the fraction of oxygenated hemoglobin equals the oxygen saturation, expressed as a fraction. The difference between the two can be seen from the example below. Note that this primarily is useful when used in relation to ctHb.
- ctHb = 10 mmol/L
- cHHb = 0.2 mmol/L
- cCOHb = 3 mmol/L ~ 30 %
- cO2Hb = 6.8 mmol/L
![]()
![]()
Calculated saturation
Most blood gas analyzers without a CO-oximeter provide a readout for saturation.
However, the value is then calculated rather than measured. The calculation is complex and takes into account the various factors that can affect the shape of the oxyhemoglobin dissociation curve. The mathematical description and the variables in this vary for different brands of analyzer.
Clinically important errors can result from using estimated sO2 in other calculations, such as those for shunt fraction and oxygen content [4].
It is discouraged to make an estimation of sO2 from a measurement of pO2 and vice versa using a standard ODC. The consequences of this can be seen from Fig. 2, which is based on the measurement of 10,179 blood samples [5].
This shows that with an sO2 of 90 % the corresponding pO2 is from 29-137 mmHg (4-18 kPa) and a pO2 of 60 mmHg (8 kPa) corresponds to an sO2 of 70 to 99 %.
All in all, the most reliable sO2 is by the measurement by a CO-oximeter. This also gives the advantage that FO2Hb, FCOHb and FMetHb can be reported as well.
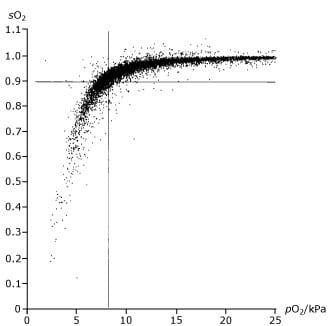
FIG. 2. Graph of blood saturation measurements showing poor correlation with the partial pressure of oxygen in the blood.
Clinical application
Oxygen content is a key indicator of oxygen transport within the body. The oxygen transport of arterial blood is used to evaluate the capability of transporting oxygen from the lungs to the tissue. Oxygen transport, defined as the amount of oxygen being transported per liter arterial blood, depends primarily on:
- The total content of oxygen in the arterial blood, ctO2 - the key parameter for evaluation of oxygen transport
- The concentration of hemoglobin in the blood (ctHb)
- The concentration of dyshemoglobins (cCOHb and cMetHb)
- The arterial oxygen tension (pO2)
- The arterial oxygen saturation (sO2), which again is determined by pO2 and p50
Hence oxygen saturation is not the sole indicator of oxygen transport. The presence of dyshemoglobins and/or a low concentration of hemoglobin can cause severe reductions in the oxygen transport capacity of the arterial blood.
Conclusion
For many purposes, sO2 (either measured by pulse oximeter or calculated by a blood gas analyzer) is sufficient to make clinical decisions. When applied appropriately, pulse oximetry can result in advantages such as continuous monitoring, reduced cost and reduced blood loss (important when caring for neonates).
However, when poisoning by carbon monoxide or other substances that can affect hemoglobin is suspected, FO2Hb, as measured with a bench hemoximeter, is required.
Clinical guidelines for the use of pulse oximeters and hemoximeters are available from the American Association for Respiratory Care [6,7]. Related recommendations have been published by the National Committee for Laboratory Standards [8,9].
References+ View more
- Astrup P, Severinghaus JW. The history of blood gases, acids and bases. Copenhagen: Munksgaard, 1986: 128-56.
- Van Slyke DD, Neill JN. The determination of gases in blood and other solutions by vacuum extraction and manometric measurement. J Biol Chem 1924; 61: 523-73.
- Tobin MJ. Principles and practice of intensive care monitoring. New York: McGraw-Hill, 1998: 305-07.
- Hess D, Elser RC, Agarwal N. The effect of measured versus calculated hemoglobin oxygen saturation, carboxyhemoglobin and methemoglobin on the pulmonary shunt calculation. Respir Care 1984; 29: 1001-05.
- Gøthgen IH, Siggaard-Andersen O, Kokholm G. Variation in the hemoglobin-oxygen dissociation curve in 10079 arterial blood samples. Scand J Clin Lab Invest 1990; 50, Suppl 203: 87-90.
- American Association for Respiratory Care. Clinical practice guideline: In vitro pH and blood gas analysis and hemoximetry. Respir Care 1993; 38: 505.
- American Association for Respiratory Care. Clinical practice guideline: Pulse oximetry. Respir Care 1991; 36: 1406.
- Reference and selected procedures for the quantitative determination of hemoglobin in blood. Ed. 2. NCCLS Publication H15-A2, 1994;14,6.
- Fractional oxyhemoglobin, oxygen content and Saturations, and related quantities in blood: terminology, measurement, and reporting; approved guideline. NCCLS Publication. Wayne, PA. NCCLS Publication, 1997; 12,11.
References
- Astrup P, Severinghaus JW. The history of blood gases, acids and bases. Copenhagen: Munksgaard, 1986: 128-56.
- Van Slyke DD, Neill JN. The determination of gases in blood and other solutions by vacuum extraction and manometric measurement. J Biol Chem 1924; 61: 523-73.
- Tobin MJ. Principles and practice of intensive care monitoring. New York: McGraw-Hill, 1998: 305-07.
- Hess D, Elser RC, Agarwal N. The effect of measured versus calculated hemoglobin oxygen saturation, carboxyhemoglobin and methemoglobin on the pulmonary shunt calculation. Respir Care 1984; 29: 1001-05.
- Gøthgen IH, Siggaard-Andersen O, Kokholm G. Variation in the hemoglobin-oxygen dissociation curve in 10079 arterial blood samples. Scand J Clin Lab Invest 1990; 50, Suppl 203: 87-90.
- American Association for Respiratory Care. Clinical practice guideline: In vitro pH and blood gas analysis and hemoximetry. Respir Care 1993; 38: 505.
- American Association for Respiratory Care. Clinical practice guideline: Pulse oximetry. Respir Care 1991; 36: 1406.
- Reference and selected procedures for the quantitative determination of hemoglobin in blood. Ed. 2. NCCLS Publication H15-A2, 1994;14,6.
- Fractional oxyhemoglobin, oxygen content and Saturations, and related quantities in blood: terminology, measurement, and reporting; approved guideline. NCCLS Publication. Wayne, PA. NCCLS Publication, 1997; 12,11.
May contain information that is not supported by performance and intended use claims of Radiometer's products. See also Legal info.


Acute care testing handbook
Get the acute care testing handbook
Your practical guide to critical parameters in acute care testing.
Download now
Related webinar
Evolution of blood gas testing Part 1
Presented by Ellis Jacobs, PhD, Assoc. Professor of Pathology, NYU School of Medicine.
Watch the webinar