Printed from acutecaretesting.org
January 2009
An introduction to reference intervals (1) - some theoretical considerations
As is the case for all scientific data, the clinical laboratory test result has no value in isolation. There needs to be some control, standard or reference value for comparison.
Comparison is as fundamental to clinical medicine as it is to any other scientific discipline. When doctors note clinical signs and symptoms during clinical examination and interview, they consciously or subconsciously make reference to a database of signs and symptoms associated with disease for comparison with those presenting in their patient. Similarly, interpretation of a laboratory test result is a process of comparison.
The type of reference used for comparison depends on the nature of the clinical question being asked of the laboratory test. For example, if the test is being used to monitor a specific disease process, previous test results from that patient might be the most appropriate reference for comparison; serial concentration of blood tumor markers to assess response to cancer therapy [1] is a nice exemplar.
Some laboratory tests are used not for diagnosis or monitoring but to make specific clinical decisions. For example, measurement of serum cholesterol is most often used for assessment of cardiovascular disease risk and to determine if cholesterol-lowering advice/drugs are indicated. In such circumstances a particular concentration of the analyte, known as the "decision limit", has to be defined [2].
The decision limit is then the reference for comparison. Some laboratory tests are used to monitor drug therapy. Here patient results are compared with a so-called "therapeutic range" [3], which defines the range of drug concentration in blood consistent with maximum therapeutic and minimum adverse (toxic) effect.
Of all the tools designed for comparison (interpretation) of patient test results, the most widely used is the population-based "health-associated" reference interval.
This is what is usually meant by the shortened unqualified term "reference interval", the main focus of this article. For reasons that will hopefully become clear, alternative commonly used terms such as "reference range", "normal range" and "expected values" are considered inappropriate, although they do serve the useful purpose here of broadly conveying what is meant when we use the correct (expertly based), but maybe less familiar term "reference interval".
CONCEPT OF THE REFERENCE INTERVAL
Notwithstanding the examples given above, in most clinical situations when a doctor is faced with a laboratory test result for his patient, he will probably first like an answer to the fundamental question: "if this particular patient were in good health, would this test result be the same?"
The question can be restated as: "does this test result indicate a healthy (i.e. normal) or non-healthy status for my patient?" A definitive answer to this question is not possible because it depends at the very least on an objective definition of health and test results from the patient when in a state of "good health", both of which are lacking.
Although a definitive answer is not possible, the reference interval is designed to provide the best possible answer, and the "correctness" of the answer depends on the quality or "goodness" of the reference interval. A "good" reference interval is one that, when applied to the population serviced by the laboratory, correctly includes most of the subjects with characteristics similar to the reference group and excludes others [4].
Good "health-associated" reference intervals will, with a clinically acceptable degree of statistical probability, include all those from the reference population who are healthy with respect to the particular measurement being considered and exclude all those with a pathology (disease) for which there is an association with the measurement being considered.
The concept of the reference interval was introduced by Grasbeck and Saris in 1969 [5] in response to growing awareness, expressed with great clarity in a reflective paper from Schneider [6], that the concept of normal range, as then conceived, was flawed. Current practice at the time was to compare patient results with an ill-defined, or at least inconsistently defined, range of values (called the "normal range") derived from an ill-defined population of supposedly "normal", meaning healthy, individuals.
Medical students and laboratory staff were favored subjects for the construction of normal ranges, this choice being born more of convenience rather than any real scientific belief or evidence that they were representative of the patient population with which they were to be compared. The assumption contained in the term "normal range" that medical students, laboratory staff or any other chosen "normal" population are healthy went largely unchallenged.
Normal ranges constructed using one analytical methodology were frequently applied, sometimes inappropriately, to interpret patient results derived using a different methodology.
Quite apart from perceived lack of scientific (statistical) rigor deployed in constructing and utilizing normal ranges, the term "normal range" itself was considered imprecise and ambiguous, because "normal" has several meanings: statistical, epidemiological and clinical [7].
Statistical use of the term "normal" implies that values (e.g. serum sodium, cholesterol, albumin, etc.) are distributed in the population in accordance with the theoretical bell-shaped, perfectly symmetrical curve, known as "Normal" or "Gaussian" distribution (FIGURE 1).
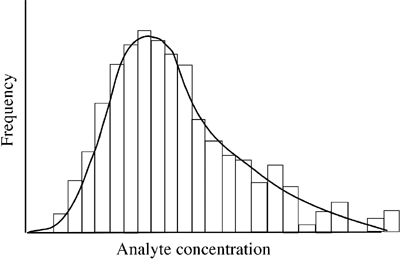
For some analytes there is indeed an observed distribution that approximates to normal distribution, but that is by no means always the case and for many analytes the distribution curve is skewed, to a lesser or greater degree, either to the left or right (FIGURE 2).
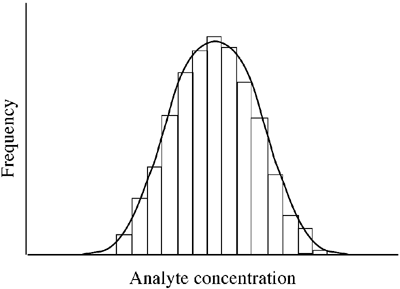
FIGURE 1: Normal (Gaussian) distribution of analyte concentration
 ¨
¨
FIGURE 2: Skewed (non-Gausian) distribution
From an epidemiological viewpoint it may be "normal" (i.e. usual) for serum cholesterol to be greater than 5.5 mmol/L, but from a clinical viewpoint it certainly is not normal (i.e. healthy) for serum cholesterol to be that high. In short, "normal range" is an imprecise term, incompatible with the scientific rigor required for development of the most accurate interpretive tool.
In line with the overall objective of introducing scientific rigor, a clear unambiguous definition of terms for a unifying concept of reference intervals was required and in 1986, after much expert deliberation and consultation, the International Federation of Clinical Chemistry (IFCC) agreed on a set of definitions [8] that continue to underpin the theory and practice of reference intervals today.
IFCC DEFINITION OF TERMS
- A REFERENCE INDIVIDUAL is an individual selected for comparison using defined criteria.
- A REFERENCE POPULATION consists of all possible reference individuals. It usually has an unknown number and is therefore a hypothetical entity.
- A REFERENCE SAMPLE GROUP is an adequate number of reference individuals taken to represent the reference population. Ideally they should be randomly drawn from the reference population.
- A REFERENCE VALUE is the value (test result) obtained by observation or measurement of a particular quantity on an individual belonging to a reference sample group. Not to be confused with reference limit (see below).
- A REFERENCE DISTRIBUTION is the statistical distribution of reference values. Hypotheses regarding reference distribution obtained from a reference population can be tested using the reference distribution of the sample group and adequate statistical methods. The parameters of the hypothetical distribution of the reference population may be estimated using the reference distribution of the reference sample group and adequate statistical methods.
- A REFERENCE LIMIT is derived from the reference distribution and is used for descriptive purposes. It is common practice to define a reference limit so that a stated fraction of the reference values is less than or equal to, or more than or equal to the respective upper or lower limit. A reference limit is descriptive only of reference values and should not be confused with the term "decision limit".
- A REFERENCE INTERVAL is the interval between and including two reference limits. The term "reference range" was rejected because strictly (statistically) speaking range is the difference between the highest and lowest value in a number set; it is a single value.
- OBSERVED VALUE (patient test result) is the value of a particular type of quantity obtained by either observation or measurement and produced to make a medical decision. It can be compared with reference values, reference distributions, reference limits or reference intervals.
The working relationship between these terms is described in TABLE 1.
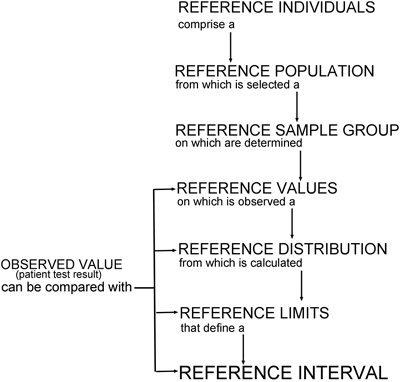
TABLE 1: Relationship between defined terms
The process of reference interval construction comprises four main steps:
- Defining the reference population
- Selecting reference individuals
- Measurement of the analyte in reference individuals
- Statistical examination of measured data - determination of reference limits
Each of these steps will be considered in turn as we briefly address some of the theoretical issues surrounding construction and use of reference intervals
DEFINING THE REFERENCE POPULATION
The IFCC-recommended use of the term "reference population" does not define or describe the reference population.
For example, presence of health is not implied, allowing the construction of reference intervals for both the healthy and the sick. Defining the reference population is fundamental for the preparation of effective reference intervals.
This definition must be based on a clear understanding of how the reference interval is to be used, which in turn must be based on a clear understanding of the analyte (measurand) in question as regards, for example, its pathophysiological significance and biological variance. Clearly, for "health-associated" reference intervals the reference population must be healthy but there are other considerations, the most significant being age and gender. Ethnicity and socioeconomic factors may in some circumstances be significant.
The important point is that the reference population should be an acceptable "control" for patients, having due regard for the way in which the test result is to be used. Whatever the chosen characteristics of the reference population, they should be clearly defined so that the most appropriate reference sample group can be selected.
SELECTING REFERENCE INDIVIDUALS
Ideally the reference sample group should perfectly reflect the reference population. This can only be achieved if reference individuals are selected randomly from the reference population.
Since random selection demands that every member of the reference population - which may number thousands, if not millions - has an equal chance of being selected, it is difficult, if not impossible to achieve in practice. Despite this, random selection is a goal that should be strived for, and definite non-random selection (e.g. selecting only from laboratory workers or blood donors) is to be avoided if possible.
For the construction of "health-related" reference intervals, reference individuals must be in good health, but health is a relative concept, difficult to define and even more difficult to pin down in individuals [9].
For example, adults may be suffering latent or subclinical disease (e.g. atherosclerosis) although they may well be in apparent good health. A subjective feeling of good health ("I feel fine") is no guarantee of healthy status. Given that it is difficult to define health in any meaningful or helpful way, the usual pragmatic solution is to attempt to exclude all those with disease and perhaps those with an unhealthy lifestyle.
To this end, exclusion criteria for the selection of reference individuals might include: current illness, recent hospitalization, use of prescription or recreational drugs, obesity, smoking habit, raised blood pressure, etc. Whatever the exclusion criteria used to select "healthy" reference individuals, these will vary according to the pathophysiological significance of the analyte concerned; they need to be appropriate and justified.
For example, past history of jaundice might be considered an appropriate exclusion criterion when constructing a reference interval for plasma bilirubin but probably would not be considered appropriate (necessary) if the objective was a reference interval for plasma sodium. Other inclusion/exclusion criteria (e.g. age, gender ethnicity, etc.) might need to be applied to ensure that reference individuals have so far as is possible the same characteristics as those of the defined reference population.
Apart from qualitative considerations for the selection of reference individuals it is important to consider the size of the reference sample group. Clearly the greater the size, the greater is the statistical confidence that the derived reference interval is the "true" reference interval for the reference population. An absolute minimum of 40 samples is required to compute a reference interval that includes 95 % from the mid range of a data set and excludes 2.5 % at either end of the range [10] (see below for the significance of this).
The IFCC recommends that a reference sample group should comprise not less than 120 individuals. This is the minimum number needed to calculate the 90 % confidence limits of a 95 % reference interval determined by non-parametric statistics [11,12]. Larger numbers of reference individuals (up to 700) are required if the analyte being considered displays particularly marked skewness [12].
It may be considered necessary to partition a reference group with regard to age or perhaps sex in order to provide age- or gender-specific reference intervals [13]. In such cases each partitioned population should comprise at least 120 individuals.
MEASUREMENT OF THE ANALYTE IN REFERENCE INDIVIDUALS
Having selected a reference sample group of adequate size, attention turns to measurement of the particular analyte under study, in the selected reference individuals. A crucial consideration here is the reduction of unnecessary or avoidable variation [14]. This reduces the "biological noise" of a reference interval, making it more likely that the "biological signal" of disease in patient samples will be detected.
Variability can be considered under two headings: preanalytical, the variability due to factors acting before analysis, and analytical variation.
Preanalytical variability is further divided into in vivo variability due to biological factors, and in vitro variability due to non-biological factors. In vivo factors that might affect analyte concentration include: type of sample, chronobiological rhythms (daily, weekly, monthly, seasonal), fasting, time since last food, posture (standing, sitting, lying), recent exercise and use of tourniquet during sample collection.
In vitro variability relates to sample collection and handling. The factors of interest here include the significance of hemolysis, type of sample container, preservatives in sample container, length of time between sample collection and centrifugation/analysis and sample storage conditions.
The study required for the construction of reference intervals requires consideration of all possible preanalytical sources of variability and an assessment of their individual significance for the analyte under study. This allows production of a specific protocol that defines reference-individual preparation, timing of sample collection, type of sample, detail of sample collection and sample-handling details, etc. In line with the philosophical stance that reference individuals are "controls" for patients, it is essential that this protocol applied to reference individuals is also applied with equal diligence when collecting and handling samples from patients.
The methodology used to generate reference values should ideally be identical to that used to generate observed values (patients test results). If not identical, methods must be comparable in terms of precision and accuracy, traceable to a common standard [15].
It is of course important that the analytical variability of observed values is the same as that of reference values. To this end reference values should be determined by analyzing samples alongside patient samples. They should be analyzed in several batches to take account of the analytical variability over time (between-batch variability) that patient samples are inevitably subject to.
STATISTICAL EXAMINATION OF MEASURED DATA
In this final section we look at the way data (reference values) generated by measurement in reference individuals are used to construct reference intervals. It is an arbitrary but long-held and widely applied convention that observed values (patient test results) be compared not with the full range of reference values but with the truncated 95 % of values that lie in the mid range of the reference distribution [7,10,17]. The 2.5 % of values at either end are excluded so that the two reference limits that define the reference interval are the values of the 2.5th and 97.5th percentile of the reference distribution.
Reference limits can be estimated by parametric or non-parametric statistical methods [7]. Parametric methods can only be applied to Gaussian distributions, and if the analyte displays skewed (non-Guassian) distribution, reference values must be transformed (e.g. by log transformation) to a log-Gaussian distribution for parametric methods to be applied [16].
Histogram display of reference values as in Figs. 1 and 2 may suggest a Gaussian distribution (Fig. 1), but in practice complex statistical tools have to be applied to reference data (and transformed reference data) in order to confirm that it approximates sufficiently to a Gaussian distribution before a parametric method can be applied to determine reference limits.
Once Gaussianity is confirmed, the mean (x) and standard deviation (SD) of reference values are calculated and these parameters are used to determine reference limits. For a Gaussian distribution, 95 % of values lie within ± 1.96 standard deviations of the mean, so that the 2.5 % and 97.5 % reference limits are (x – 1.96 SD) and (x + 1.96 SD) respectively (Fig. 3).
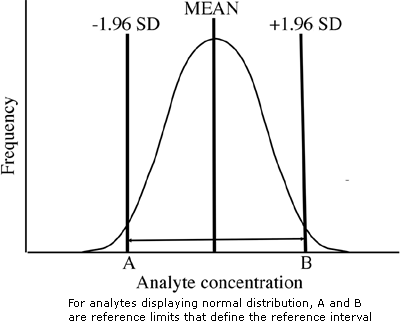
FIGURE 3: Estimation of reference interval (parametric method)
Non-parametric statistical methods are much simpler and can be applied to data irrespective of distribution characteristics. The IFCC-recommended method for estimating reference intervals is a non-parametric method that essentially involves simply excluding the lowest and highest 2.5 % of reference values.
It is common practice to calculate the 90 % confidence interval (CI) for each of the two estimated reference limits. This indicates with 90 % confidence the interval within which the "true" reference limit would fall if reference values from the whole reference population had been used to estimate it, providing an indication of the reliability of the estimated reference limits.
SUMMARY
For this introductory overview the reference interval has been placed in context as one of many tools used to interpret laboratory test results. The IFCC definitions of terms that underpin the science of reference intervals have been highlighted and some of the problems (and solutions) associated with construction and use of reference intervals discussed.
It hopefully provides a sound basis for discussion of more practical matters in a second article.
References+ View more
- Perkins G, Slater E, Sanders G et al. Serum tumour markers. Am Fam Physician 2003; 68: 1075-82.
- Appleton C, Caldwell G, McNeil A et al. Recommendation for lipid testing and reporting by Australian pathology laboratories. Clin Biochem Review 2007; 28: 32-45.
- Amisden A. Serum concentration and clinical supervision in monitoring of lithium treatment. Ther Drug Monit 1980; 2: 73-83.
- Cerriotti F. Pre-requisites for use of common reference intervals. Clin Biochem Rev 2007; 28: 115-21.
- Grasbeck R, Saris NE. Establishment and use of normal values. Scand J Clin Lab Invest 1969; 26 (Suppl 110): 62-63.
- Schneider AJ. Some thoughts on normal or standard values in clinical medicine. Pediatrics 1960; 26: 973-84.
- Solberg H, Grasbeck R. Reference values. Adv Clin Chem 1989; 27: 1-79
- Solberg H (on behalf of IFCC). Approved recommendation (1986) on the theory of reference values. Part 1 The concept of reference values. Clin Chim Acta 1987; 167: 111-18.
- Grasbeck R. Reference values, why and how. Scand J Clin Lab Invest 1990;50 Suppl 210: 45-53.
- Jones R, Payne B. Data for diagnosis and monitoring (Chapter 3) In: Clinical investigations and statistics in laboratory medicine. ACB Venture Publications 1997.
- Horn PS, Pesce AJ. Reference intervals: an update. Clin Chim Acta 2003; 334: 5-23.
- Linnet K. Two-stage transformations for normalization of reference distributions evaluated. Clin Chem 1987; 33: 381-86.
- Harris EK, Boyd J. On dividing reference data into subgroups to produce separate reference ranges. 1990; 36: 265-70
- Fraser CG. Inherent biological variation and reference values. Clin Chem Lab Med 2004; 42: 758-64.
- Koumantakis G. Traceability of measurement results. Clin Biochem Rev 2008;29:S61-S66.
- Peterson P, Gowans EMS, Blaabjerg O et al. Analytical goals for the estimation of non-Gaussian reference intervals. Scand J Clin Lab Invest 1989; 49: 727-37.
- Solberg HE. Establishment and use of reference values (Chapter 16) In: Burtis CA, Ashwood E, Bruns D. Tietz Textbook of Clinical Chemistry and Molecular Diagnostics (4th Ed) Saunders 2005.
References
- Perkins G, Slater E, Sanders G et al. Serum tumour markers. Am Fam Physician 2003; 68: 1075-82.
- Appleton C, Caldwell G, McNeil A et al. Recommendation for lipid testing and reporting by Australian pathology laboratories. Clin Biochem Review 2007; 28: 32-45.
- Amisden A. Serum concentration and clinical supervision in monitoring of lithium treatment. Ther Drug Monit 1980; 2: 73-83.
- Cerriotti F. Pre-requisites for use of common reference intervals. Clin Biochem Rev 2007; 28: 115-21.
- Grasbeck R, Saris NE. Establishment and use of normal values. Scand J Clin Lab Invest 1969; 26 (Suppl 110): 62-63.
- Schneider AJ. Some thoughts on normal or standard values in clinical medicine. Pediatrics 1960; 26: 973-84.
- Solberg H, Grasbeck R. Reference values. Adv Clin Chem 1989; 27: 1-79
- Solberg H (on behalf of IFCC). Approved recommendation (1986) on the theory of reference values. Part 1 The concept of reference values. Clin Chim Acta 1987; 167: 111-18.
- Grasbeck R. Reference values, why and how. Scand J Clin Lab Invest 1990;50 Suppl 210: 45-53.
- Jones R, Payne B. Data for diagnosis and monitoring (Chapter 3) In: Clinical investigations and statistics in laboratory medicine. ACB Venture Publications 1997.
- Horn PS, Pesce AJ. Reference intervals: an update. Clin Chim Acta 2003; 334: 5-23.
- Linnet K. Two-stage transformations for normalization of reference distributions evaluated. Clin Chem 1987; 33: 381-86.
- Harris EK, Boyd J. On dividing reference data into subgroups to produce separate reference ranges. 1990; 36: 265-70
- Fraser CG. Inherent biological variation and reference values. Clin Chem Lab Med 2004; 42: 758-64.
- Koumantakis G. Traceability of measurement results. Clin Biochem Rev 2008;29:S61-S66.
- Peterson P, Gowans EMS, Blaabjerg O et al. Analytical goals for the estimation of non-Gaussian reference intervals. Scand J Clin Lab Invest 1989; 49: 727-37.
- Solberg HE. Establishment and use of reference values (Chapter 16) In: Burtis CA, Ashwood E, Bruns D. Tietz Textbook of Clinical Chemistry and Molecular Diagnostics (4th Ed) Saunders 2005.
May contain information that is not supported by performance and intended use claims of Radiometer's products. See also Legal info.
Acute care testing handbook
Get the acute care testing handbook
Your practical guide to critical parameters in acute care testing.
Download nowRelated webinar
Evolution of blood gas testing Part 1
Presented by Ellis Jacobs, PhD, Assoc. Professor of Pathology, NYU School of Medicine.
Watch the webinar


