Printed from acutecaretesting.org
June 2001
Biological variation and quality for POCT


INTRODUCTION
Clinical laboratory test results are used in many clinical settings including screening, case finding, teaching and training, plus research and development.
However, most are used in monitoring individuals over time and in the diagnostic process. There is considerable evidence that the performance characteristics of the tests do affect clinical outcomes in both of these situations.
Performance characteristics involve both practicability and reliability characteristics.
The former include skills required, speed of analysis, plus volume and type of sample required.
The latter include precision, bias, limit of detection, and measuring range. It is often suggested that, for POCT, turnaround time is the most important performance characteristic.
However, quality specifications for the reliability performance characteristics, particularly precision and bias, are vital for creation and management of the analytical quality that impinges on test result interpretation.
However, it is given that quality specifications should be firmly based upon medical requirements, useable in all laboratories irrespective of size, type or location – including POCT, generated using simple-to-understand models, and generally supported by professionals in the field.
For about 40 years, there has been a steady stream of publications concerned with the generation and application of quality specifications [1].
There appeared to be a real conflict about how to set quality specifications, but a decisive recent advance was that a consensus was reached in 1999 on global strategies to set quality specifications in laboratory medicine [2].
This consensus was based upon a hierarchical approach published just prior to the consensus conference [3].
The hierarchy is shown below (Table I). All the approaches have advantages and disadvantages, but quality specifications based on components of biological variation (strategy 2A) seem very widely favored and will be discussed in detail in this contribution.
|
TABLE I: Hierarchical approach to classification of strategies for setting quality specifications. |
THE EFFECT OF ANALYTICAL PERFORMANCE ON GENERAL CLINICAL OUTCOMES
The second strategy in the hierarchy is the creation of quality specifications based on components of biological variation – within-subject (CVI) and between-subject (CVG) variation.
These are directly related to outcomes in monitoring and diagnosis.
Monitoring
Considering monitoring first, probably no one would disagree that analytical random variation must be kept low so that any changes seen in test results in an individual over time are clinically interesting.
In other words, we need to see the “signal” (real change) and not just the “noise” (analytical random variation – precision). For POCT, this is really important because, historically, the analytical performance achieved in alternate sites was not so good as in laboratories and, in consequence, the signal-to-noise ratio was rather low. In consequence, results obtained in POCT settings were of less than desirable quality.
This is important, because it is often said that an advantage of POCT is that patients can be monitored closely and frequently.
Monitoring involves comparison of serial test results from an individual over time. In the simplest model, changes in serial results can be due to:
- the patient improving
- the patient deteriorating
- preanalytical variation
- biological variation (within-subject) and
- analytical variation – mostly inherent random variation, measured as precision (CVA)
If preanalytical sources of variation are made as small as possible, then, to assess whether change has occurred, it must exceed the inherent variation due to biological and analytical variation which is now best termed the “reference change value”(RCV) which can be calculated as:
RCV = 2½ · Z · (CVA2 + CVI2)½
where Z is the number of standard deviates appropriate to the probability selected (for example, 1.96 for P < 0.05 and 2.58 for P < 0.01).
Calculation of the effect of precision on medical decision-making is straightforward. If we investigate cholesterol (CVI ~ 6 %) as one example of a widely done POCT procedure in pharmacies, clinics, physician’s offices and other alternate sites, the change required for significance (at P < 0.05) increases with precision as shown in Table II.
|
TABLE II: Effect of precision on reference change value for serum cholesterol at P < 0.05. |
The quality specification advocated for precision is that the analytical variation should be less than one-half the average within-subject biological variation [4]. The rationale for this was expounded by Harris who showed that, if CVA < 0.50CVI, then the amount of variability added was about 10 % – said to be “reasonable” [5].
This proposal has been very widely accepted by professionals. This concept has been expanded more recently. Three classes of analytical quality (optimum, desirable, and minimum), based upon different fractions of within-subject biological variation, have been proposed as shown in Fig. 1 [6].
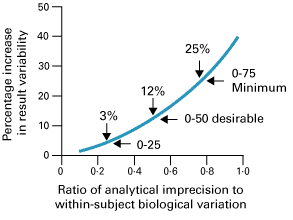
FIG. 1: Percentage increase in test result variability due to analytical precision (expressed as a ratio of analytical-to-within-subject biological variation) showing three possible quality specifications based on within-subject biological variation. From Fraser CG et al. Ann Clin Biochem 1997; 34: 8-12 (shown with permission).
Diagnosis
Interpretation of numerical laboratory test results in the diagnostic setting can be aided by: use of locally agreed protocols for clinical action; values proposed by expert individuals, groups or committees; values based on outcomes, for example risk such as for cholesterol; and multiples of the upper reference limit. However, many use population-based reference values.
Patients often have tests done in various locations such as the emergency room, the outpatient clinic, the ward – in which POCT may be used – and in the laboratory.
Test results should be comparable over location. Surely then, all testing sites serving a homogeneous population should all use the same reference values. For this to be achieved, it has been shown [7] that bias should be less than one-quarter of the group biological variation (that is, B < 0.25(CVI2 + CVG2)½).
Again, three classes of analytical quality, optimum, desirable and minimum, based upon different fractions of within- plus between-subject biological variation, have been proposed as shown in Fig. 2 [6].
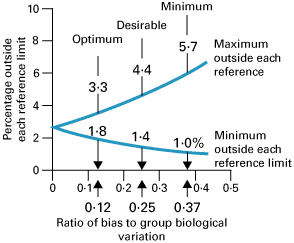
FIG. 2: Percentage of results outside reference limits due to analytical bias (expressed as a ratio of analytical-to-group (within- plus between-subject) biological variation) showing three possible quality specifications based on biological variation. From Fraser CG et al. Ann Clin Biochem 1997; 34: 8-12 (shown with permission).
THE ADVANTAGES OF BIOLOGICAL VARIATION-BASED QUALITY SPECIFICATIONS
These strategies, directly related to the clinical uses made of test results, have many merits. Data on biological variation are available for more than 300 quantities. A recent compilation in the easily available literature and on the Internet makes the data easy to obtain [8].
The data seem independent of study location, number of subjects, length of study, analytical methodology, age of subjects, or whether they are in a state of health or have a stable, but chronic disease.
Moreover, data on components of biological variation have been used to define quality specifications for other characteristics and in other laboratory settings [9]. The models are simple. The strategies appear to be widely supported by professionals. Their use in quality planning is advocated, including for POCT.
References+ View more
- Fraser CG. Quality specifications in laboratory medicine. Clin Biochem Revs 1996; 17: 109-14.
- Consensus statement from “Strategies to set global quality specifications in laboratory medicine”. Stockholm, April 24-27, 1999. Available at www.westgard.com.
- Fraser CG, Hyltoft Petersen P. Analytical performance characteristics should be judged against objective quality specifications. Clin Chem 1999; 45: 321-23.
- Cotlove E, Harris EK, Williams GZ. Biological and analytic components of variation in long-term studies of serum constituents in normal subjects. III. Physiological and medical implications. Clin Chem 1970; 16: 1028-32.
- Harris EK. Statistical principles underlying analytic goal-setting in clinical chemistry. Am J Clin Pathol 1979; 374: 72-82.
- Fraser CG, Hyltoft Petersen P, Libeer JC, Ricos C. Proposals for setting generally applicable quality goals solely based on biology. Ann Clin Biochem 1997; 34: 8-12.
- Gowans EMS, Hyltoft Petersen P, Blaabjerg O, Horder M. Analytical goals for the acceptance of common reference intervals for laboratories throughout a geographical area. Scand J Clin Lab Invest 1988; 48: 757-64.
- Ricos C, Alvarez V, Cava F, Garcia-Lario JV, Hernandez A, Jimenez CV, Minchinela J, Perich C, Simon M. Current databases on biological variation: pros, cons and progress. Scand J Clin Lab Invest 1999; 59: 491-500. Available at www.westgard.com/guest17.htm.
- Fraser CG. Quality specifications in laboratory medicine – current consensus views. Accred Qual Assur 1999; 4: 410-13.
References
- Fraser CG. Quality specifications in laboratory medicine. Clin Biochem Revs 1996; 17: 109-14.
- Consensus statement from “Strategies to set global quality specifications in laboratory medicine”. Stockholm, April 24-27, 1999. Available at www.westgard.com.
- Fraser CG, Hyltoft Petersen P. Analytical performance characteristics should be judged against objective quality specifications. Clin Chem 1999; 45: 321-23.
- Cotlove E, Harris EK, Williams GZ. Biological and analytic components of variation in long-term studies of serum constituents in normal subjects. III. Physiological and medical implications. Clin Chem 1970; 16: 1028-32.
- Harris EK. Statistical principles underlying analytic goal-setting in clinical chemistry. Am J Clin Pathol 1979; 374: 72-82.
- Fraser CG, Hyltoft Petersen P, Libeer JC, Ricos C. Proposals for setting generally applicable quality goals solely based on biology. Ann Clin Biochem 1997; 34: 8-12.
- Gowans EMS, Hyltoft Petersen P, Blaabjerg O, Horder M. Analytical goals for the acceptance of common reference intervals for laboratories throughout a geographical area. Scand J Clin Lab Invest 1988; 48: 757-64.
- Ricos C, Alvarez V, Cava F, Garcia-Lario JV, Hernandez A, Jimenez CV, Minchinela J, Perich C, Simon M. Current databases on biological variation: pros, cons and progress. Scand J Clin Lab Invest 1999; 59: 491-500. Available at www.westgard.com/guest17.htm.
- Fraser CG. Quality specifications in laboratory medicine – current consensus views. Accred Qual Assur 1999; 4: 410-13.
May contain information that is not supported by performance and intended use claims of Radiometer's products. See also Legal info.


Acute care testing handbook
Get the acute care testing handbook
Your practical guide to critical parameters in acute care testing.
Download now
Scientific webinars
Check out the list of webinars
Radiometer and acutecaretesting.org present free educational webinars on topics surrounding acute care testing presented by international experts.
Go to webinars