Printed from acutecaretesting.org
January 2005
Biological variation and reference (normal) values
Patients in Intensive Therapy Units (ITU), High Dependency Units, Emergency Rooms and other critical care areas benefit considerably from the use of point-of-care testing (POCT) because rapidly available biochemical and hematological test results are necessary prerequisites to optimum patient care [1].
Recently in ITU, BN, a 79-year-old woman with acute renal failure, atrial fibrillation and sepsis, had her morning blood gases and electrolytes done in the ITU minilaboratory by the nurse looking after her.
As described previously [2], this approach has been used for some years, nurses and doctors undertaking the analyses, while laboratory staff provide quality control and assurance, maintenance, training and advice.
The results on the sample were printed out and collated, with other data, for discussion on the multidisciplinary ward round. On the round, the Consultant asked about the patient’s hemoglobin result in particular because it had been low previously.
The Registrar stated that the hemoglobin was 9.9 g/dL and that this was still low, the normal range on the report being 12.0-16.0 g/dL with the results flagged as being low on the POCT analyzer printout. The results were discussed, the treatment plan reviewed, and the team passed to the next patient.
FJ was a 73-year-old man who had undergone an emergency laparotomy. The Registrar again looked at the printout and reported that the patient’s hemoglobin, perhaps unsurprisingly after operation, was 10.1 g/dL. This was also flagged as low on the report because the normal range on the report was 13.0-18.0 g/dL.
The Registrar then stated that this normal range was not the same as that for the previous patient and asked why such differences between various patient groups existed, because this did seem quite common.
It being an unusually quiet day in the ITU, the Consultant then asked the Clinical Biochemist attending the ward round to tell the group how the normal ranges were decided and why they differed from patient to patient.
Terminology
The Clinical Biochemist explained that, in laboratory medicine, the term “normal range” had been considered obsolete for some time, although still much used in everyday clinical language and in communication of test results between health professionals.
This was mainly because the word “normal” could have very many meanings in clinical practice, including healthy, common or frequent, harmless, Gaussianly distributed, and so on. The terminology now favored was “reference intervals”. The topic of reference intervals was an ongoing matter of great interest to laboratory professionals, as exemplified by the recent publication of an entire journal issue on still controversial aspects [3] with contributions from experts from all over the world.
The generation and application of reference intervals had been elaborated mainly by The Expert Panel on Theory of Reference Values of the International Federation of Clinical Chemistry (IFCC), and this important body of work had been collated in a comprehensive review [4].
Moreover, professional bodies remained interested and the National Committee for Clinical Laboratory Standards (NCCLS) had recently prepared a superb guideline on how to define and determine reference intervals in the clinical laboratory [5].
The concept is as follows:
- reference individuals
- make up a reference population
- from whom are selected a reference sample group
- on whom are determined reference values
- on which is observed a reference distribution
- from which are determined reference limits
- that define a reference interval.
The IFCC recommended use of the term reference interval. This is very often called a reference range but, pedantically, a range is actually the numerical difference between two numbers and it is intervals that are used in laboratory medicine.
The Registrar said that this was a nice theoretical concept but there were very many tests done in laboratory medicine both as POCT and in laboratories and asked how the reference intervals supplied with each report for every test done were obtained in practice.
Sources of reference intervals
The Clinical Biochemist explained that it was indeed a very complex matter and that senior laboratory staff spent considerable time ensuring that the reference intervals quoted were appropriate. It was a formidable task to follow the IFCC [4] and NCCLS [5] guidelines to the letter.
This involved a number of steps including: selection of at least 120 reference individuals applying strict inclusion and exclusion criteria, taking samples under highly controlled conditions, analyzing the samples in batches when the analytical system was under preset quality control conditions, assessing whether there were outlying values, and then statistically manipulating the data to derive the reference interval.
The Consultant asked how it was possible to do such studies for, for example, arterial blood pH and gases in adults, capillary blood analyses in neonates and other analytes of particular interest to ITU, and remarked that much of the information that was used every day was in fact calculated rather than measured, for example, actual bicarbonate.
It was suggested that deriving formal reference intervals for these examples and many other analytes would pose significant ethical as well as technical difficulties.
The Clinical Biochemist agreed that it was sometimes very difficult, if not impossible, to translate theory into everyday practice, in spite of its scientific rigor. In the local laboratory network, a hierarchical approach to delineation of reference intervals had been adopted.
This hierarchy involved the following approaches, in order of probity, and all of them had been used:
- strict adherence to the approaches of IFCC [4] and NCCLS [5]: this had been done for the most commonly requested analytes,
- this approach but with a less stringent selection of the reference sample population, for example, blood donors or patients without problems likely to affect the analyte: this had been done for certain more esoteric analytes,
- specific literature on reference values, particularly individual publications with data obtained with the particular methodology used in the laboratory,
- general literature concerning reference values, particularly compendia from professional bodies,
- other specific literature of a quality able to be cited in the Standard Operating Procedures, and
- manufacturers’ data as quoted in technical data sheets, kit inserts and similar materials.
This pragmatic approach had been published in a recent book [6] that gives much information on generation and application of population-based reference values.
The Registrar said that this was very interesting and suggested that few clinicians would know exactly how reference intervals were derived. The Registrar had been taught that the reference interval did encompass only 95 % of the population and therefore knew that 1 in 20 healthy individuals had values outside the reference interval.
It was also recognized that, simply because of probability and statistics, the more tests that were done on an individual the more chance there was of finding a result that was outside what the Clinical Biochemist had termed reference limits.
Consequences of biological variation for reference intervals
The Clinical Biochemist referred to a previous ward round at which the concepts of within-subject and between-subject biological variation had been discussed [2]. As briefly mentioned then, knowledge of these was very relevant to population-based reference intervals.
Creatinine, an analyte much used in ITU and available there and in other locations such as the Diabetes Center as POCT, provided an excellent example.
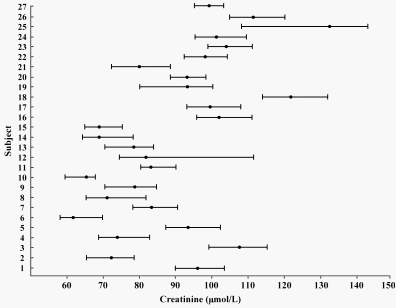
The Clinical Biochemist drew Fig. 1: subjects 1-13 were women and 14-27 men.
The author of this interesting study on creatinine [7] had pointed out that:
- no individual had test results that spanned the entire reference interval and the results from each individual occupied only a small part of the reference interval,
- the means for most individuals lay within the reference interval and were different from each other,
- a few individuals had results which spanned the lower reference limit and these individual had values which changed from “normal” to “abnormal” (as clinicians would usually say) over time, and
- a few individuals had results that spanned the upper reference limit and these individuals also had values that changed from normal to abnormal over time.

FIG. 1. Means and absolute values for serum creatinine
in 27 elderly people (from [7])
It was clear that the within-subject variation (the ranges – the length of the bars) was smaller than the between-subject variation (the difference between the means – the central dots).
Of course, as always, the Clinical Biochemist liked to use abbreviations and numbers. The within-subject variation (CVI) was 4.3 % and the between-subject variation (CVG) was 18.3 %. For creatinine, CVI is very much less than CVG and is said to have marked individuality. A useful parameter, termed the “index of individuality”, was calculated simply as CVI/CVG and this was 0.24: low indices of individuality meant the analyte is very individual.
The Clinical Biochemist said that data on within- and between-subject components of variation were available for very many analytes [8] and that the vast majority had low indices of individuality. Individuality in biology and medicine was usual!
Individuality and the utility of reference intervals
The Consultant said that it was quite easy to work out the likely ramifications of this individuality on everyday clinical practice. Clearly, people could have results that were highly unusual for them, but these results could still lie within the reference interval. Clinicians would not call them “abnormal” although the results would be unusual for the individual.
The Charge Nurse at the round remarked that neither the POCT analyzer nor most laboratory reports would flag such results because the individual's results were simply compared to the population reference interval and this very real “abnormality” would be missed.
The Registrar joined in the discussion and said that it was now clear why creatinine was not a very good test for the detection of minor degrees of renal impairment. Collecting one sample from an individual and comparing the result to the reference interval would not be productive for detecting the small changes likely in early disease.
However, changes in creatinine were very useful indicators of real changes in renal function, and the Registrar remarked that the use of reference change values (RCV), discussed at an earlier ward round [2], obviously had significant advantages over population-based reference intervals in monitoring change in individual patients.
The Consultant extended the discussion and said that individuality provided a logical explanation for the well-known fact that clinical laboratory investigations were not very productive when used in large admission profiles or in what the very junior doctors described as “screening for disease” when they requested many investigations in case they missed something clinical of note.
The Registrar remarked that it was also interesting that individuals could have results that changed, simply through inherent variation, from within to outside reference intervals.
All on the ward round agreed that they had seen this phenomenon in clinical practice and had sometimes been confused about what to do with these “slightly abnormal” results that became “normal” on repeat.
Stratification of reference intervals
The Registrar then stated that the reference intervals for creatinine on both the POCT analyzer and the laboratory reports were not always the same.
In addition, children had lower reference intervals than adults and women had lower reference intervals than men, for example. The others present at the ward round had noticed this also and not only for creatinine.
For example, as had stimulated this discussion at the beginning of the round, hemoglobin had different reference intervals for men and women, and reference intervals for pH and partial pressures of gases were different in neonates and adults.
The Clinical Biochemist replied that there were many factors that affected reference intervals. These included endogenous factors such as age and gender, exogenous factors such as exercise, food intake and posture, ethnic and genetic factors, sample factors such as whether arterial, capillary or venous, and laboratory factors, particularly the analytical methodology.
There were two consequences.
The first was that clinicians should really only use the reference intervals provided on the POCT analyzer or by the laboratory that produced the test results, and that was a major reason why reference intervals were included on every report.
The second consequence was that, when the effect of such factors could be accurately defined, particularly age and gender, the laboratory gave a set of what were termed “stratified” reference intervals. Usually, laboratory handbooks or user guides had comprehensive databases of reference intervals.
Stratification (sometimes called partitioning) was very interesting. If urine creatinine output was taken as an example, for men and women together as one population group, the index of individuality is 0.46 and therefore a single population-based reference interval would be of little value – exactly as per the scenario for serum creatinine.
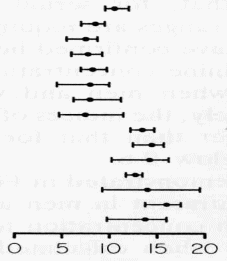
The Clinical Biochemist drew Fig. 2 to show published data [9] for urine creatinine on eight women (upper subjects) and seven men (lower subjects). Women are clearly different from men, having lower creatinine output.
However, all the women are rather like all the other women and all the men are rather like the other men. Now, if the different genders were taken separately, within-subject variation becomes much larger than between-subject variation.
The indices of individuality then become
1.42 and 1.83 respectively and, in consequence, stratification
according to gender has vastly increased the utility of
conventional population-based reference intervals.

Urine Creatinine (mmol/d)
FIG. 2. Absolute ranges for daily urine creatinine output in 15 healthy individuals (modified from [9])
Since most quantities have marked individuality, laboratory professionals always consider stratification when reference intervals are being developed. It is well documented how to decide if stratification is necessary [3], although mathematically rather complex. The underlying rationale for stratification is that the index of individuality is made larger.
All agreed that this had been an interesting and educational ward round. And all had learned much about the production and utility of population-based reference intervals.
References+ View more
- Price CP, St John A, Hicks JM, eds. Point-of-Care Testing. 2nd edition. Washington, DC: AACC Press, 2004.
- Fraser CG. Biological variation – what’s it all about?, www.bloodgas.org, 2004
- Hyltoft Petersen P, Henny J. Reference values. Clin Chem Lab Med 2004; 42: 685-873.
- Solberg HE, Grasbeck R. Reference values. Adv Clin Chem 1989; 27: 1-79.
- How to define and determine reference intervals in the clinical laboratory; approved guideline; 2nd edition. NCCLS publication C28-A.Villanova, PA: National Committee for Clinical Laboratory Standards, 2000.
- Fraser CG. Biological Variation: From Principles to Practice. Washington, DC: AACC Press, 2001.
- Fraser CG. Biological variation in the elderly; implications for reference values. In: Faulkner WR, Meites S, eds. Geriatric Clinical Chemistry Reference Values. , Washington, DC: AACC Press1994: 44.
- Ricós C, García-Lario J-V, Alvarez V, et al. Biological variation database, and quality specifications for imprecision, bias and total error (desirable and minimum). www.westgard.com/guest26.htm, The 2004 update.
- Gowans EMS, Fraser CG. Biological variation of serum and urine creatinine and creatinine clearance: ramifications for interpretation of results and patient care. Ann Clin Biochem 1988; 25: 259-63.
References
- Price CP, St John A, Hicks JM, eds. Point-of-Care Testing. 2nd edition. Washington, DC: AACC Press, 2004.
- Fraser CG. Biological variation – what’s it all about?, www.bloodgas.org, 2004
- Hyltoft Petersen P, Henny J. Reference values. Clin Chem Lab Med 2004; 42: 685-873.
- Solberg HE, Grasbeck R. Reference values. Adv Clin Chem 1989; 27: 1-79.
- How to define and determine reference intervals in the clinical laboratory; approved guideline; 2nd edition. NCCLS publication C28-A.Villanova, PA: National Committee for Clinical Laboratory Standards, 2000.
- Fraser CG. Biological Variation: From Principles to Practice. Washington, DC: AACC Press, 2001.
- Fraser CG. Biological variation in the elderly; implications for reference values. In: Faulkner WR, Meites S, eds. Geriatric Clinical Chemistry Reference Values. , Washington, DC: AACC Press1994: 44.
- Ricós C, García-Lario J-V, Alvarez V, et al. Biological variation database, and quality specifications for imprecision, bias and total error (desirable and minimum). www.westgard.com/guest26.htm, The 2004 update.
- Gowans EMS, Fraser CG. Biological variation of serum and urine creatinine and creatinine clearance: ramifications for interpretation of results and patient care. Ann Clin Biochem 1988; 25: 259-63.
May contain information that is not supported by performance and intended use claims of Radiometer's products. See also Legal info.
Acute care testing handbook
Get the acute care testing handbook
Your practical guide to critical parameters in acute care testing.
Download nowScientific webinars
Check out the list of webinars
Radiometer and acutecaretesting.org present free educational webinars on topics surrounding acute care testing presented by international experts.
Go to webinars


