Printed from acutecaretesting.org
June 2018
Clarifying the confusion of GFRs, creatinine, and cystatin C


Summary Because measurements of GFR are tedious, estimated GFRs based on creatinine or cystatin C are widely used for assessing kidney function. Both measured GFRs and the Staging System for CKD based on GFR have analytical and clinical shortcomings. The advantages of serum creatinine and cystatin C, and eGFR will be discussed.
Abbreviations: GFR = glomerular filtration rate; mGFR = measured GFR; eGFR = estimated GFR; MDRD = Modification of Diet in Renal Disease; CKD-EPI = Chronic Kidney Disease Epidemiology Collaboration; C-G = Cockcroft-Gault; IDMS = isotope dilution mass spectrometry; CKD = chronic kidney disease
Introduction
Many methods for assessing kidney function have been developed over the past century, most notably measurements of serum creatinine, glomerular filtration rate (GFR), urea, and cystatin C. Determining the measured GFR (mGFR) requires measurement of an endogenous marker such as creatinine [1], or an exogenous marker such as inulin [2], iothalamate, 51Cr-EDTA, or iohexol. However, all techniques for measuring GFR are time-consuming and tedious.
Measurement of serum creatinine and cystatin C are more convenient and rapid tests for evaluating kidney function. Especially for within-individual monitoring, both are reliable kidney function tests for detecting both acute and chronic declines of kidney function [3].
(Cockcroft-Gault (C-G), Modification of Diet in Renal Disease (MDRD), and Chronic Kidney Disease Epidemiology Collaboration (CKD-EPI)) are more correctly regarded as measures of serum creatinine and/or cystatin C that have been adjusted for age, gender, and race, then factored to produce a numerical quantity similar to a measured GFR. While these equations can give average agreement between eGFR and mGFR, the variation is large, with a 30 % difference considered acceptable.
Misconceptions about all these kidney function tests are common, including serum creatinine, mGFR by clearance tests (creatinine, iothalamate, inulin, etc.), the calculated eGFR, the perceived benefit of isotope-dilution mass spectrometry (IDMS) standardization of creatinine methods, and the accurate definition of “clearance”.
Serum creatinine
However, such plots use a compacted y-axis scale of serum creatinine in increments of 1.0 mg/dL (88 µmol/L), which is well above the detection limit of modern automated methods for serum creatinine of about 0.05 mg/dL (5 µmol/L). If this best-fit line is plotted on a scale of 0.1 mg/dL, the sensitivity of serum creatinine becomes readily apparent as GFR declines, as also shown in Fig. 1.
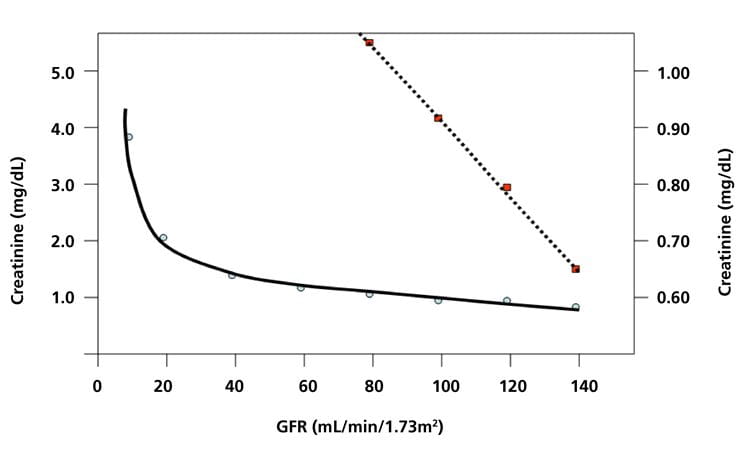
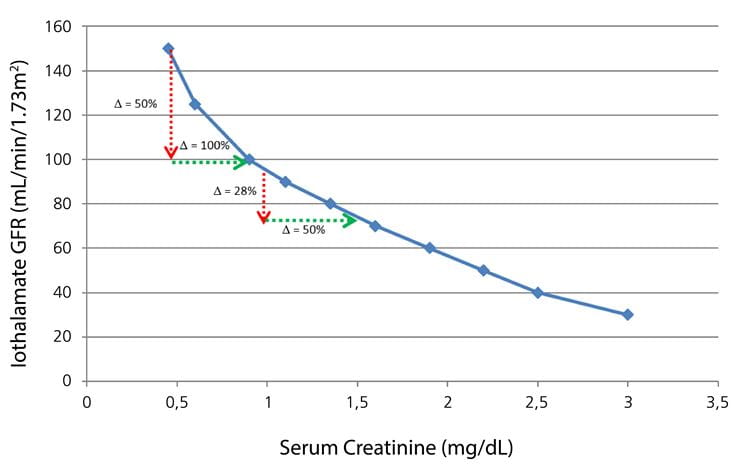
FIG. 2: Plot of iothalamate GFR vs serum creatinine, showing that the average percent change in creatinine is larger than the average percent change in GFR. Examples: For a GFR change of 150 to 100 (50 % change), the creatinine increases from about 0.45 to 0.90 mg/dL (100 % change). For a GFR decrease from 95 to 74 (28 % change), the creatinine increased from 1.0 to 1.5 mg/dL (50 % change).
Plotted from data in J Am Soc Nephrol 2006; 17: 854-62.
Note also that the reference ranges for serum creatinine (approximately 0.73-1.37 mg/dL = ratio 1.88), cystatin C (0.55-1.15 mg/L = ratio 2.09) and GFR (67-135 mL/min/1.73 m2: ratio 2.01) all have about the same relative ranges [8,9]. While both serum creatinine, cystatin C, eGFRs, and mGFRs (by creatinine, inulin, iothalamate) all have relatively large and proportionately similar reference ranges [8,9], the within-individual variations for serum creatinine, cystatin C, and eGFR are much lower than for mGFR by creatinine clearance [5,10], or by iothalamate and inulin methods [7,11].
As expected, eGFRs calculated from creatinine or cystatin C correlate poorly with clearance measurements of GFR, either by creatinine, iothalamate or inulin clearance, especially in the normal range [5,9,11].
IDMS standardization of creatinine
Creatinine methods are now commonly standardized to an isotope-dilution mass spectrometry (IDMS) reference method [12], which should lessen the systematic bias between methods and improve agreement among both creatinine and eGFR results from different institutions. However, it will have no effect on either the imprecision of a particular creatinine method or on the inherent random differences between calculated eGFR and measured GFR.
Serum cystatin C
Plasma concentrations of cystatin C are reliable markers for detecting and monitoring the progression of kidney disease. Both creatinine and cystatin C are each affected by factors other than GFR, with creatinine affected by factors related to muscle mass (age, gender, and race), and cystatin C affected by age, inflammation, obesity, and diabetes [13]. Like serum creatinine, cystatin C concentrations were much more stable in individuals without renal disease than was GFR measured by creatinine clearance [5].
A possible advantage of cystatin C with minor glomerular damage is that, being a large molecule, blood levels of cystatin C might rise sooner than creatinine. Several reports also indicate that cystatin C is better than creatinine for predicting risk in cardiovascular disease [14], although other studies did not conclude that cystatin C improved risk prediction [8,15]. Cystatin C is also a more costly, slower, and less available test than creatinine. Cystatin C now has a certified reference material available that should improve method standardization for that analyte.
The term “clearance”
“Clearance” is a misunderstood term originally used by physiologists to calculate the net volume of blood cleared of a specific substance per unit of time by the combination of glomerular filtration, renal tubular reabsorption, and tubular secretion. While “clearance” would logically be the rate at which a substance is removed from the blood, with units such as mmol/min, the actual units are volume/time, such as mL/min. Thus, the “clearance” is more correctly regarded as a measurement of the GFR, if the measured substance is freely filtered and neither reabsorbed nor secreted by the kidney tubules.
Clearance = timed urine volume (mL/min) × (urine concentration / plasma concentration)
Both an accurately timed urine sample and a blood sample must be collected. The timed urine volume represents the concentrated volume of the original glomerular filtrate, while the ratio of the urine concentration to the plasma concentration of the substance such as creatinine or inulin represents the factor (approximately 100 fold) that the glomerular filtrate has been concentrated as it becomes urine.
Methods for measuring GFR by plasma clearance
Iohexol clearance. Iohexol solution is injected and allowed to distribute in the extracellular fluid, then blood samples are collected at timed intervals. The iohexol is measured and the GFR is calculated [16].
Iothalamate clearance. Iothalamate is injected subcutaneously and allowed to equilibrate for 45 minutes. Then a 7-mL blood sample is collected along with the patient emptying their bladder. After 45-60 min (accurately timed), another blood sample and a urine sample are collected. Then the urine and blood samples are analyzed for iothalamate [11].
51Cr-EDTA method. Subjects are injected intravenously with 51Cr-EDTA solution, then 6-mL blood samples are drawn from the opposite arm at 2, 3, and 4 h. The plasma concentrations of 51Cr-EDTA are then measured in a gamma counter, with the log [51Cr-EDTA] against time used to determine the GFR [17].
Although often regarded as “gold standard” tests, mGFRs are highly variable and often do not agree with each other [11,18], as shown in Fig. 3, and do not agree with endogenous serum markers such as creatinine and cystatin C.
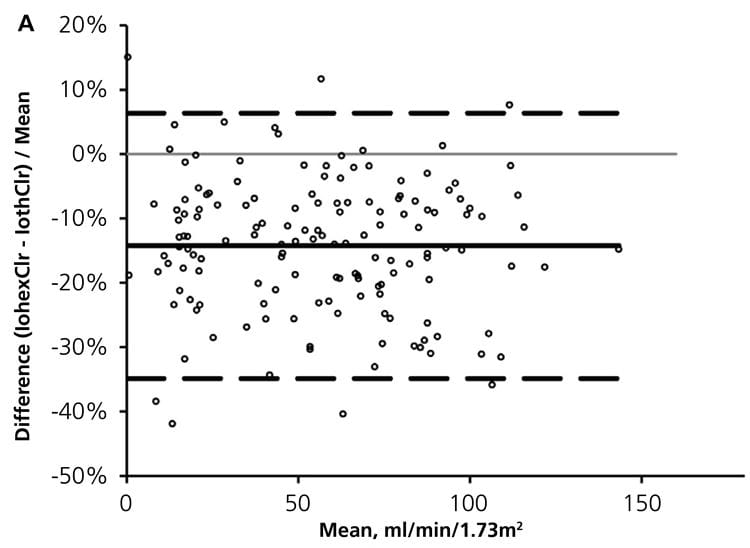
FIG. 3: Percent differences between measured GFRs: Iohexol vs iothalamate clearances. (from Seegmiller et al. Am J Kidney Dis 2016: 67: 49-55)
This variation between serum markers and measured GFRs appears to be inherent, as shown in plots of eGFR vs measured GFR, whether calculated from serum creatinine or cystatin C [5,6,7,19]. The GFR is also affected by diet and hemodynamic alterations. Thus, mGFR has many shortcomings as a clinical marker to detect declining renal function in CKD.
Equations for calculating eGFR
Because of the challenges of measuring GFR by clearance or other tests, equations have been developed to calculate eGFR from serum creatinine and/or cystatin C with factors such as age, gender, race, and weight. For many years, the C-G formula [20] used a creatinine normalized for age, gender, and weight to estimate GFR based on creatinine clearance and is still the standard for calculating the dosage of drugs based on a patient’s kidney function.
In 1999, the MDRD equation for eGFR was published. It was based on normalizing serum creatinine for age, gender, and race, with factors included to numerically resemble GFR [21]. The intent was to provide a kidney function parameter that would lessen the likelihood of chronic kidney disease (CKD) going unnoticed by non kidney specialists. However, a significant clinical limitation of the MDRD eGFR was the recommendation to only report eGFRs below 60 mL/min/1.73 m2.
This was done to avoid incorrectly classifying patients as having Stage 1 (GFR < 90 mL/min/1.73 m2) or Stage 2 CKD (60-89 mL/min/1.73 m2), but who had no apparent kidney disease, which resulted from the significant overlap between the normal range for mGFR (72-140 mL/min/1.73 m2) and both Stage 1 and Stage 2 classifications of CKD. Furthermore, nephrologists commonly find the eGFR to be <60 mL/min/1.73 m2 in elderly persons with no evidence of kidney disease and who have a serum creatinine that is stable at a slightly elevated level.
The CKD-EPI equation gives lower eGFR values than the MDRD equation in the normal ranges, as shown by a plot of eGFR values for a 50-year-old white male (Fig. 4).
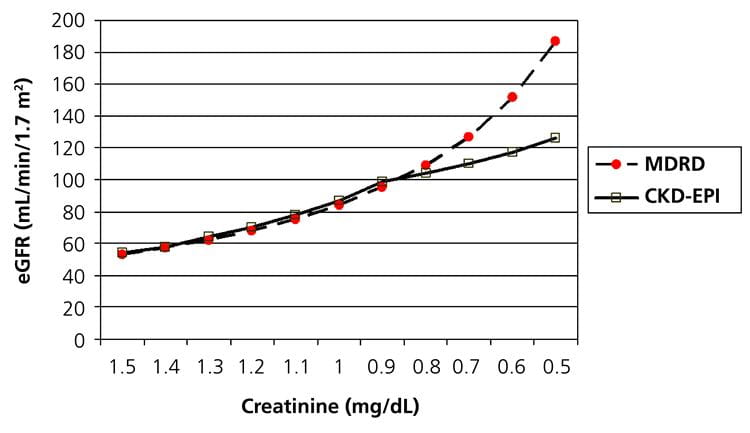
FIG. 4: eGFR calculated from serum creatinine by both the MDRD (dashed line with round dots) and CKD-EPI (solid line with squares) equations for a 50-year-old white male.
Although the improved agreement of the CKD-EPI eGFR to mGFR was modest, going from 80.6 % of the MDRD eGFRs to 84.1 % of the CKD-EPI eGFRs being within 30 % of the mGFR, the greater value of the CKD-EPI eGFR could ultimately be if all values of eGFR are reported [19].
Because blood concentrations of creatinine/cystatin C are relatively stable over time in persons with normal kidney function and mGFR is a renal filtration measurement that fluctuates continually, it appears inevitable that all comparisons of eGFRs to mGFRs will show large variation. As such, the eGFR should be interpreted as an independent parameter for detecting and monitoring kidney function. Furthermore, reporting all values of eGFR would allow it to become a useful guide for interpreting creatinine and/or cystatin C results.
Equations using cystatin C to estimate GFR
Because of higher expense and less availability, eGFR based on cystatin C (eGFRcysC) will probably not replace eGFR by creatinine. However, studies suggest that having both eGFRcreat and eGFRcysC can improve the risk prediction for end-stage kidney disease [21]. If both eGFRcreat and eGFRcysC are available, a discrepancy between the two could indicate the need for further testing, such as with iohexol clearance [22].
For comparing the clinical utility of the eGFR equations to measurements of GFR, a most relevant point was reported by Grubb that over 15 years of study, the combined creatinine/cystatin C eGFR disagreed with their “gold standard” iohexol procedure only 10 times. In each case, the discrepancy was due to technical problems with the iohexol procedure [23].
Shortcomings of staging kidney disease based on GFR
Summary
References+ View more
- Rehberg PB. Studies on kidney function. I. The rate of filtration and reabsorption in the human kidney. Biochem J 1926; 20: 447-53.
- Shannon J, Smith HW. The excretion of inulin xylose, and urea by normal phlorizinized man. J Clin Invest 1935; 14: 393.
- Spanaus K-S, Kollerits B, Ritz E, Hersberger M, Kronenberg F, von Eckerstein A. Serum creatinine, cystatin C, and B-trace protein in diagnostic staging and predicting progression of primary nondiabetic chronic kidney disease. Clin Chem 2010; 56: 740-49.
- Shemesh O, Golbetz H, Kriss JP, Myers BD. Limitations of creatinine as a filtration marker in glomerulopathic patients. Kidney Int 1985; 28: 830-38.
- Toffaletti JG, McDonnell EH. Variation of serum creatinine, cystatin C, and creatinine clearance tests in persons with normal renal function. Clin Chim Acta 2008; 395: 115-19.
- Botev R, Mallie J-P, Couchoud C, Schuck O, Fauvel J-P, Wetzels JFM, et al. Estimating glomerular filtration rate: Cockcroft-Gault and modification of diet in renal disease formulas compared to renal inulin clearance. Clin J Am Soc Nephrol 2009; 4: 899-906.
- Rule AD, Torres VE, Chapman AB, Grantham JJ, Guay-Woodford LM, Bae KY, et al. Comparison of methods for determining renal function decline in early autosomal dominant polycystic kidney disease: The consortium of radiologic imaging studies of polycystic kidney disease cohort. J Am Soc Nephrol 2006; 17: 854-62.
- Ribichini F, Gamboro G, Graziani MS, Pighi M, Pesarini G, Pasoli P, Anselmi M, et al. Comparison of serum creatinine and cystatin C for early diagnosis of contrast-induced nephropathy after coronary angiography and interventions. Clin Chem 2012; 58: 458-64.
- Rule AD, Larson TS, Bergstralh EJ, Slezak JM, Jacobsen SJ. Using serum creatinine to estimate glomerular filtration rate: accuracy in good health and disease. Ann Intern Med 2004; 141: 929-37.
- Andersen TB, Erlandsen EJ, Frokiaer J, Eskild-Jensen A, Brochner-Mortensen J. Comparison of within- and between-subject variation of serum cystatin C and serum creatinine in children aged 2-13 years. Scand J Clin Lab Invest 2010; 70: 54-59.
- Ocampo JH, Rosales AT, Castellanow FR. Comparison of four methods for measuring glomerular filtration rate by inulin clearance in healthy individuals and patients with renal failure. Nefrologia 2010; 30: 324-30.
- Myers GL, Miller WG, Coresh J, Fleming J, Greenberg N, Greene T, et al. Recommendations for improving serum creatinine measurement; A report from the Laboratory Working Group of the National Kidney Disease Education Program. Clin Chem 2006; 52: 5-18.
- Stevens LA, Schmid CH, Greene T, Li L, Beck GJ, Joffe MM, et al. Factors other than glomerular filtration rate affect serum cystatin C levels. Kidney Int 2009; 75: 652-60.
- Peralta CA, Katz R, Sarnak MJ, Ix J, Fried LF, De Boer I, et al. Cystatin C identifies chronic kidney disease patients at higher risk for complications. J Am Soc Nephrol 2011; 22: 147-55.
- Beilby J, Divitine ML, Knuilman MW, Rossi E, Hung J. Comparison of cystatin C and creatinine as predictors of cardiovascular events in a community-based elderly population. Clin Chem 2010; 56: 799-804.
- Ericsen BO, Mathisen UD, Melson T, Ingebretsen OC, Jenssen TG, Njolstad I, et al. Cystatin C is not a better estimator of GFR than plasma creatinine in the general population. Kidney Int 2010; 78: 1305-11.
- Grewel GS, Blake GM. Reference data for 51Cr-EDTA measurements of the GFR derived from live kidney donors. Nucl Med Commun 2005; 26: 61-65.
- Seegmiller JC, Burns BE, Schinstock CA, Lieske JC, Larson TS. Discordance between iothalamate and iohexol urinary clearance. Am J Kidney Dis 2016; 67: 49-55.
- Levey AS, Stevens LA, Schmid CH, Zhang YL, Castro III AF, Feldman HI, et al. A new equation to estimate glomerular filtration rate. Ann Intern Med. 2009; 150: 604-12.
- Cockcroft DW, Gault MH. Prediction of creatinine clearance from serum creatinine. Nephron 1976; 16: 31-41.
- Levey AS, Bosch JP, Lewis JB, Greene T, Rogers N, Roth D, et al. A more accurate method to estimate glomerular filtration rate from serum creatinine: a new prediction equation. Ann Intern Med 1999; 130: 461-70.
- Grubb A, Nyman U, Bjork J. Improved estimation of glomerular filtration rate (GFR) by comparison of eGFRcystatin C and eGFR creatinine. Scand J Clin Lab Invest 2012; 72: 73-77.
- Grubb A. Non-invasive estimation of GFR: The Lund model: Simultaneous use of cystatin C- and creatinine-based equations, clinical data and an internal quality check. Scand J Clin Lab Invest 2010; 70: 65-70.
- Lamb EJ, Brettell EA, Cockwell P, Dalton N, Deeks JJ, Harris K, et al. The eGFR-C study: Accuracy of GFR estimation using creatinine and cystatin C and albuminuria for monitoring disease progression in patients with stage 3 chronic kidney disease – prospective longitudinal study in a multiethnic population. BMC Nephrology 2014; 15: 13.
- Peralta CA, Shlipak MG, Judd S, Cushman M, McClellan W, Zakai NA, et al. Detection of chronic kidney disease with creatinine, cystatin C, and urine albumin-to-creatinine ratio and associations with progression to end-stage renal disease and mortality. JAMA 2011; 305: 1545-52.
References
- Rehberg PB. Studies on kidney function. I. The rate of filtration and reabsorption in the human kidney. Biochem J 1926; 20: 447-53.
- Shannon J, Smith HW. The excretion of inulin xylose, and urea by normal phlorizinized man. J Clin Invest 1935; 14: 393.
- Spanaus K-S, Kollerits B, Ritz E, Hersberger M, Kronenberg F, von Eckerstein A. Serum creatinine, cystatin C, and B-trace protein in diagnostic staging and predicting progression of primary nondiabetic chronic kidney disease. Clin Chem 2010; 56: 740-49.
- Shemesh O, Golbetz H, Kriss JP, Myers BD. Limitations of creatinine as a filtration marker in glomerulopathic patients. Kidney Int 1985; 28: 830-38.
- Toffaletti JG, McDonnell EH. Variation of serum creatinine, cystatin C, and creatinine clearance tests in persons with normal renal function. Clin Chim Acta 2008; 395: 115-19.
- Botev R, Mallie J-P, Couchoud C, Schuck O, Fauvel J-P, Wetzels JFM, et al. Estimating glomerular filtration rate: Cockcroft-Gault and modification of diet in renal disease formulas compared to renal inulin clearance. Clin J Am Soc Nephrol 2009; 4: 899-906.
- Rule AD, Torres VE, Chapman AB, Grantham JJ, Guay-Woodford LM, Bae KY, et al. Comparison of methods for determining renal function decline in early autosomal dominant polycystic kidney disease: The consortium of radiologic imaging studies of polycystic kidney disease cohort. J Am Soc Nephrol 2006; 17: 854-62.
- Ribichini F, Gamboro G, Graziani MS, Pighi M, Pesarini G, Pasoli P, Anselmi M, et al. Comparison of serum creatinine and cystatin C for early diagnosis of contrast-induced nephropathy after coronary angiography and interventions. Clin Chem 2012; 58: 458-64.
- Rule AD, Larson TS, Bergstralh EJ, Slezak JM, Jacobsen SJ. Using serum creatinine to estimate glomerular filtration rate: accuracy in good health and disease. Ann Intern Med 2004; 141: 929-37.
- Andersen TB, Erlandsen EJ, Frokiaer J, Eskild-Jensen A, Brochner-Mortensen J. Comparison of within- and between-subject variation of serum cystatin C and serum creatinine in children aged 2-13 years. Scand J Clin Lab Invest 2010; 70: 54-59.
- Ocampo JH, Rosales AT, Castellanow FR. Comparison of four methods for measuring glomerular filtration rate by inulin clearance in healthy individuals and patients with renal failure. Nefrologia 2010; 30: 324-30.
- Myers GL, Miller WG, Coresh J, Fleming J, Greenberg N, Greene T, et al. Recommendations for improving serum creatinine measurement; A report from the Laboratory Working Group of the National Kidney Disease Education Program. Clin Chem 2006; 52: 5-18.
- Stevens LA, Schmid CH, Greene T, Li L, Beck GJ, Joffe MM, et al. Factors other than glomerular filtration rate affect serum cystatin C levels. Kidney Int 2009; 75: 652-60.
- Peralta CA, Katz R, Sarnak MJ, Ix J, Fried LF, De Boer I, et al. Cystatin C identifies chronic kidney disease patients at higher risk for complications. J Am Soc Nephrol 2011; 22: 147-55.
- Beilby J, Divitine ML, Knuilman MW, Rossi E, Hung J. Comparison of cystatin C and creatinine as predictors of cardiovascular events in a community-based elderly population. Clin Chem 2010; 56: 799-804.
- Ericsen BO, Mathisen UD, Melson T, Ingebretsen OC, Jenssen TG, Njolstad I, et al. Cystatin C is not a better estimator of GFR than plasma creatinine in the general population. Kidney Int 2010; 78: 1305-11.
- Grewel GS, Blake GM. Reference data for 51Cr-EDTA measurements of the GFR derived from live kidney donors. Nucl Med Commun 2005; 26: 61-65.
- Seegmiller JC, Burns BE, Schinstock CA, Lieske JC, Larson TS. Discordance between iothalamate and iohexol urinary clearance. Am J Kidney Dis 2016; 67: 49-55.
- Levey AS, Stevens LA, Schmid CH, Zhang YL, Castro III AF, Feldman HI, et al. A new equation to estimate glomerular filtration rate. Ann Intern Med. 2009; 150: 604-12.
- Cockcroft DW, Gault MH. Prediction of creatinine clearance from serum creatinine. Nephron 1976; 16: 31-41.
- Levey AS, Bosch JP, Lewis JB, Greene T, Rogers N, Roth D, et al. A more accurate method to estimate glomerular filtration rate from serum creatinine: a new prediction equation. Ann Intern Med 1999; 130: 461-70.
- Grubb A, Nyman U, Bjork J. Improved estimation of glomerular filtration rate (GFR) by comparison of eGFRcystatin C and eGFR creatinine. Scand J Clin Lab Invest 2012; 72: 73-77.
- Grubb A. Non-invasive estimation of GFR: The Lund model: Simultaneous use of cystatin C- and creatinine-based equations, clinical data and an internal quality check. Scand J Clin Lab Invest 2010; 70: 65-70.
- Lamb EJ, Brettell EA, Cockwell P, Dalton N, Deeks JJ, Harris K, et al. The eGFR-C study: Accuracy of GFR estimation using creatinine and cystatin C and albuminuria for monitoring disease progression in patients with stage 3 chronic kidney disease – prospective longitudinal study in a multiethnic population. BMC Nephrology 2014; 15: 13.
- Peralta CA, Shlipak MG, Judd S, Cushman M, McClellan W, Zakai NA, et al. Detection of chronic kidney disease with creatinine, cystatin C, and urine albumin-to-creatinine ratio and associations with progression to end-stage renal disease and mortality. JAMA 2011; 305: 1545-52.
May contain information that is not supported by performance and intended use claims of Radiometer's products. See also Legal info.


Acute care testing handbook
Get the acute care testing handbook
Your practical guide to critical parameters in acute care testing.
Download now
Scientific webinars
Check out the list of webinars
Radiometer and acutecaretesting.org present free educational webinars on topics surrounding acute care testing presented by international experts.
Go to webinars