Printed from acutecaretesting.org
May 2007
How to reduce analyzer downtime and improve processes


INTRODUCTION
At Fleury Diagnostics it was decided to make some changes in order to ensure the commitment to excellence in the production processes.
It was decided to implement a corporate maintenance management system with clear objectives and focus on increased instrument performance, control of maintenance cost, quality requirements attainment, continuous process improvement and satisfying customer needs.
The project was sponsored and started by the top management at Fleury, and a multifunction project team and a manager were selected to carry out the project.
The core lab process manager, the infrastructure maintenance manager, the purchasing manager, three maintenance planners, a maintenance technician, two clinical engineers and the project manager formed the multifunction team.
THE MAINTENANCE MANAGEMENT PROJECT
It is often said that prevention is the best way to avoid problems.
This also applies to instrument management. The intention of this article is to open the reader’s mind to strategic thinking in order to minimize analyzer downtime, reduce failures and improve the maintenance processes. The best practices within instrument management are:
- Work order planning and control
- Preventive maintenance and reliability
- Maintenance metrics
- Service contract management and inventory control
- Labor utilization and personnel involvement
WORK ORDER PLANNING AND CONTROL
Planning is the crucial success criterion in order to minimize analyzer downtime. Initially, it is necessary to map all the instruments to be managed, their location, technical information and the preventive maintenance checklists of each instrument as recommended by the vendors.
Work order planning and control basically consist of instrument identification, maintenance-type definition, planned and non-planned maintenance service data registration, tracking of annual maintenance plans, labor utilization and spare parts control.
For this purpose a Computerized Maintenance Management System (CMMS) is used.
CMMS is an essential tool in reducing analyzer downtime. The complexity of the system depends on the size of the organization and number of instruments and areas to be managed. It is required that any computerized system in use is validated according to FDA/CAP or other local regulatory institution procedures and requirements.
It is recommended to consider the following issues when a CMMS is selected: full validation package, high integration level with the organization, product costs, customization consulting costs, database type, product life cycle, interface capability, update frequency, project management methodology and technical support.
Beyond these relevant points it is fundamental to point out that the way maintenance is managed in the organization is more important than the CMMS itself; in other words, it is difficult to succeed with a powerful CMMS and a weak maintenance management.
PREVENTIVE MAINTENANCE AND RELIABILITY
Preventive maintenance (PM) is part of the laboratory production process and quality assurance of the instrument. It ensures a well-functioning analyzer, the right calibration and adjustments, a long instrument lifetime, quality requirements attainment and an updated instrument maintenance log.
The PM is defined during the initial maintenance definition of each instrument. The maintenance definition must be updated concurrently and classified in two basic ways: planned or non-planned.
PM that can be executed on condition or on time is always planned, whereas emergency corrections are always non-planned and should ideally be reduced to zero.
One method to reduce non-planned maintenance is FMECA, the Failure Mode Effect (FMEA) and Criticality Analysis (CA), which allows a self-assessment and an analysis of critical parts reliability for all instruments. An FMECA should be performed by multifunction work teams.
The duration of a critical analysis (CA) is approx. a month and the reliability analysis using FMEA takes approx. 2-3 years.
MAINTENANCE METRICS
In this section, various metrics for the maintenance management database are defined. The main metrics that can be proposed are:
- Uptime (Fig. 1)
- Downtime (Fig. 1)
- MTBF – Mean Time Between Failures (Fig. 2)
- MTTR – Mean Time To Repair (Fig. 3)
- Service types as a percentage of all work orders (Fig. 4)
Several other metrics can be used internally to manage the operation, but most important is what is effective and what is efficient in the management system.
Simply speaking, an instrument with a low MTBF and a low MTTR indicates that the technical support is efficient but not effective.
SERVICE CONTRACT MANAGEMENT AND INVENTORY CONTROL
Service contracts and agreements with vendors and service suppliers are another key point in the maintenance process.
The experience at Fleury is that presenting the instrument management system is an important point when negotiating not only the service costs but the preventive maintenance (PM) checklists, the kits and parts to be replaced during PM, the PM annual schedule, the list of spare parts and the costs of emergency corrective maintenance.
Furthermore it can be used when reviewing the technical documents after service, the work orders, the service team involved and the vendor’s commitment to PM plans and service contracts.
LABOR UTILIZATION AND PERSONNEL INVOLVEMENT
The personnel involvement in all phases of the project is another advantage of this project because the personnel is trained to effectively take part in the process by calling technical support in case of emergency services, conduct maintenance flows, fill out work orders, prepare instruments for PM, track PM routines, in overall follow-up and several other tasks.
To keep all parties motivated during the project, key performance indicators (KPIs) were used to follow up on the status and as a recognition of the obtained results. At the kickoff meeting, all employees were present and a very detailed communication plan was developed.
The schedule showed a total duration of 1 year and 3 months to carry out and close all project activities and a training plan was made to cover all personnel involved. The following are some important points from the maintenance project at Fleury:
Project requirements:
- Personnel competency improvement
- Use of CMMS (Computerized Maintenance Management System)
- Management and decisions based on metrics
- Management system must be simple and easy to use
- CMMS must be validated according to FDA requirements
- Procedures must be reviewed and improved or made for new ones
Project restrictions:
- Personnel behavior barriers
- Budget forecast
Employees involved:
- Top management
- Operators
- Project team
- Project management
- Support and administrative personnel
- Maintenance supervisor team
- Vendors and suppliers
Metrics:
- Availability and downtime
- Service types as a percentage of all work orders
- MTBF - Mean Time Between Failures
- MTTR - Mean Time To Repair
- Utilization time
- Maintenance costs
- Assistance service time
The indicator calculation formulas will not be covered in this article but can be required by contacting Fleury Diagnostics by e-mail at helder.celani@fleury.com.br.
Investments:
- USD 50,000.00
The investment covered the CMMS implementation and consulting service, labels and IT infrastructure. Two clinical engineers and two technicians were hired but their salaries were not included in the investment.
RESULTS OF THE MAINTENANCE MANAGEMENT PROJECT
The main achievements of this project has been a 10 % improvement in instrument availability and reduction in downtime, better service level and cost reduction in service contracts, spare part control, service level agreements, and business decisions based on maintenance KPIs.
The implementation of a Computerized Maintenance Management System (CMMS) with accurate historical maintenance information and fast reports is also a value-adding achievement.
After implementing the maintenance management and cost control at Fleury, 60 % of the instruments with unacceptable downtime, too low MTBF or too high MTTR have been replaced.
After the implementation the following statistics have been obtained at Fleury:
FIGURE 1: Instrument availability
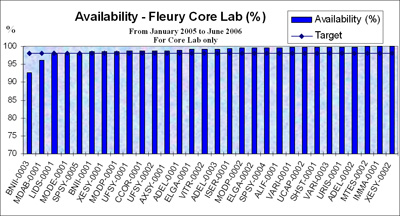 |
Figure 1 shows the availability target at Fleury at 98 %, which has been calculated with a maximum availability equal to 24 hours.
The analysis shows that some instruments still do not meet the target and the first step is to collaborate with the vendor to solve the downtime issue. If this cannot be solved within a certain time frame, the final solution is to replace the instrument. Replacing an instrument is a time-consuming task, since it means that the entire test menu of the analyzer has to be validated.
FIGURE 2: Instrument MTBF – Mean Time Between Failures
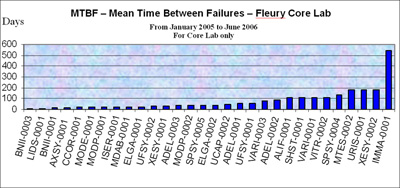 |
The MTBF is the effectiveness indicator – the higher the mean time between failures, the better. The target depends on the type of instrument and the service agreement with the vendor. At Fleury, an average of 90 days are expected; however, some vendors offer an MTBF of 45-60 days.
FIGURE 3: Instrument MTTR – Mean Time To Repair
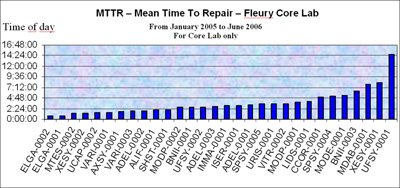 |
The MTTR is the efficiency indicator – the lower the mean time to repair, the better.
FIGURE 4: Percentage of instrument work orders and service type comparison
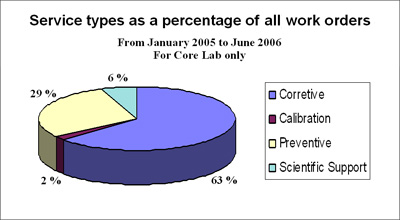 |
Figure 4 shows that corrective, non-planned maintenance is still carried out in 63 % of the service work orders. The optimal goal is to reduce non-planned maintenance from 63 % to the ideal of 0 %, but an acceptable average is approx. 20-30 % according to pharmaceutical benchmarking data.
DISCUSSION
Other achievements during this project have been the implementation of barcode identification, better maintenance procedures, instrument acquisitions, instrument localization control and general maintenance control.
It is crucial that all issues are in compliance with the quality policies and ISO 9001:2000 requirements. The investment in process improvements like this depends on the CMMS chosen, the size of the plant, number of instruments, and people involvement implementation strategy.
CONCLUSION
The maintenance management project at Fleury Diagnostics has proven the importance of a maintenance system if analyzer downtime and service costs are to be reduced.
Fleury has identified and implemented some techniques and a maintenance management system that can prevent instrument failure and ensure continuous process improvement.
May contain information that is not supported by performance and intended use claims of Radiometer's products. See also Legal info.


Acute care testing handbook
Get the acute care testing handbook
Your practical guide to critical parameters in acute care testing.
Download now
Scientific webinars
Check out the list of webinars
Radiometer and acutecaretesting.org present free educational webinars on topics surrounding acute care testing presented by international experts.
Go to webinars