Printed from acutecaretesting.org
April 2004
Multiprofile blood gas method comparison studies
Analytical method validation
The major objective of a method comparison study is to determine whether a new test method meets predefined analytical performance specifications for the analyte being tested or not. Quality specifications should always address the issue in relation to what is clinically needed and required in order to practice good medicine.
The first goal of analytical method evaluation is to find out from experimental test data how much analytical variability is present in a given method compared with another method. The second goal is to find out if this analytical variability affects the interpretation of the test results and compromises patient care. If the analytical variability is so large that it may cause clinically incorrect interpretations, the analytical method performance should be judged not acceptable.
Important questions to answer before implementing a new method or analyzer in routine laboratory work are:
- What size of error is allowable without affecting the interpretation of a test and compromising patient care?
- What kind of errors might occur with laboratory multiprofile blood gas methods?
- What kind of analytical experiments will reveal such possible errors?
- What is the best way to perform those experiments to assess those errors?
- How much data needs to be collected to obtain good estimates of errors?
- What statistics best estimate the size of those errors from experimental data?
Analytical method validation is simply experimental error assessment and proper statistical estimates of such errors!
As whole blood is living metabolizing tissue of little stability compared with aqueous solutions, the reliability of a method comparison study of multiprofile blood gas methods is highly dependent upon the procedures used to collect the data for evaluating the analytical performance characteristics.
The present article provides the user of multiprofile blood gas analyzers with very simple procedures and tools for comparing analytical measurement characteristics and methods of two blood gas analyzers. It also recommends simple statistical calculations to evaluate the size and statistical significance of experimentally determined analytical imprecision (SDT – the total analytical imprecision of a method, all variations included) and measured mean difference between two methods or analyzers.
Analytical variability
All measurements on blood gas analyzers have some analytical variability! In terms of measurement theory, analytical variability comparing two laboratory methods falls into three categories:
- Analytical imprecision of methods of two analyzers
- Analytical measured mean difference (often termed bias) between methods of two analyzers
- True mean bias between a scientifically established reference frame and each tested method of two analyzers
Studies of analytical imprecision and bias should include both short-interval periods and day-to-day variability as well as instrument-to-instrument or sensor-to-sensor variability in order to get a clear picture of the overall quality. The analytical quality specifications always got to fulfill the clinical needs and requirements of clinical decision making to be useful in the clinical setting.
Purpose of an analytical method comparison study
The purpose of an analytical method comparison study is to compare performance characteristics (imprecision and measured mean difference) of two analytical systems and determine whether these analytical performance characteristics fall within the customer’s predefined allowable total error for imprecision and measured mean difference specifications.
A study of analytical performance characteristics thus begins by defining what is to be understood by maximum allowable error for imprecision and maximum allowable error for measured mean difference between the methods evaluated. By combining the maximum allowable error for measured mean difference with a multiple of maximum allowable error for imprecision (1.65 × SDT or 2.33 × SDT) you can define your own acceptance criteria for total allowable analytical error, TEA, between methods.
- To evaluate imprecision of two methods, 50 patient samples covering a clinically significant range of results should be measured in duplicate. Each duplicate measurement on each of the two methods should be performed within a short period of time (less than three minutes) to prevent any non-analytical factors from interfering with the analytical outcome.
- To evaluate the mean difference between two methods, 50 patient samples covering a clinically significant range of results should be measured, alternating the order of measurements on each of the two methods you want to compare.
- To evaluate the true bias of two methods (not included in this protocol), the methods must be compared with a reference method or a certified standard reference material from, for example, NIST (National Institute of Standards and Technology, USA). Standards are available for Na+, K+, Cl- and pH. These standards have assigned, certified values that have been established from a primary reference method. Tonometry should be used for pO2 and pCO2 comparisons.
- Experimental protocol for estimating analytical performance characteristics of blood gas analyzer methods: Instruments should always be “side by side” to avoid metabolic interferences with the analytical results! Otherwise your study may be very much flawed with preanalytical variability that is outside the scope of any analytical instrument to solve!
Instruments
Before making any measurements, both instruments (Analyzer X and Analyzer Y) must be properly calibrated and in control as required by the manufacturers’ instructions and the quality assurance policies of your institution. Always take the time to familiarize yourself with the analytical instruments and methods you want to compare.
Having a superficial attitude and just gathering some quick data without reflecting on what you want to accomplish by doing an analytical method comparison study might in the long run be a very expensive attitude, also in terms of labor, for your laboratory as well as for the clinicians that make decisions based on your ‘lousy analytical study’. Analytical method studies are in that respect of utmost importance and really a time when clinical chemists may show their worth in being able not only to do the analysis but also to pick the method that in a cost-effective way will serve good medical practice and patient care.
Samples
Over a period of approximately five days, carefully select a total of 50 (10 per day) good-quality, well-mixed patient samples. The samples should contain at least 1-2 mL of blood from in-house patient samples stored for no longer than 30-45 minutes.
EXPERIMENTAL PRECAUTIONS
Remember that a sample of whole blood is living tissue whose analytical values may be affected by the preanalytical handling and storage of the sample. The following are precautions to be taken prior to and during performance of your method comparison.
- Prior to starting the method comparison, obtain a clear understanding of the precautions, the general experimental plan and the requirements of your protocol.
- Do not introduce preanalytical issues such as inadequate sampling techniques, improper sample storage or poor-quality patient samples into your analytical method comparison study. You only want to uncover the analytical aspects of your method comparison, not pre- or postanalytical aspects that might be examined after you have judged the acceptability of the analytical performance indicators’ imprecision and bias!
- Ensure that no air bubbles are present in the samples during the mixing or measurement of blood gases. The presence of air will affect the measurement results for oxygen and carbon dioxide tension as well as pH and ionized calcium values.
- Ensure that sufficient volume of each sample is available to perform the required duplicate analyses on each analyzer.
- Do not use patient samples containing clots or other materials that are known to interfere with either methods in your method comparison study.
- Do not include data from incomplete measurements or disqualified results during the experiment because of errors or other analytical problems.
GENERAL EXPERIMENTAL PLAN
Experimental purpose
- To estimate analytical imprecision and coefficient of variation between two analytical methods
- To estimate analytical mean difference between two analytical methods
Experimental requirements
Instrument location:
- Instruments located side by side
Sample syringes
- Samples to be collected in well-heparinized syringes
Total number of samples
- 50 high-quality patient samples
- Minimum specimen volume: 1-2 mL
Type of measurement
- Duplicate measurements on each analyzer on the same patient sample
Time between compared measurements
- Less than three minutes
ACCEPT OR REJECT PATIENT SAMPLE RESULTS
Quickly review the results of compared measurements from the two analyzer printouts and troubleshoot any problems that may be present.
- Accept: If you find everything experimentally in order, accept the patient sample results and carefully document the accepted results of Analyzer X(1) and Analyzer X(2) and Analyzer Y(1) and Analyzer Y(2) for all parameters for the first patient sample on the preprinted Data Log Form
- Reject: If you do not consider the results from Procedure A acceptable or if one or both analyzers failed during the experiment, reject the results and do not include the patient sample in the statistical data analysis!
INTERPRETATION OF IMPRECISION RESULTS
Analytical imprecision for each of the two analyzers "SDX" and "SDY" as well as “CVX” and “CVY” should be compared with your own predefined acceptability criteria for the analytical imprecision of a specific parameter. It is important to point out that the value of imprecision for two instruments might statistically be different (shown by the statistical F-test where P < 0.05 (less than 5 %)).
When you find such a statistically significant difference, the calculated F-test probability value is simply the probability of obtaining a value of the test that is statistically as high or higher than the one computed when in reality there is no difference between the imprecision of the two methods. The judgment of max. acceptable imprecision of a method should always be put in proper perspective not only of statistical and analytical significance but also, most importantly, of clinical significance.
Measured mean difference
From the consecutive duplicate measurements on 50 patient samples on each of the two analyzers, Analyzer X and Analyzer Y, you may estimate a possible analytical measured mean difference (Analyzer Y – Analyzer X) for measurements on your two analyzers as well as estimate the standard deviation and 95 % tolerance range around the mean difference.
Interpretation of mean difference results
A statistical mean difference (possible significant constant offset) between two methods should be compared with your own predefined max. acceptability criteria for this analytical performance characteristic. A statistically paired t-test shows if, on the average, the bias between two methods is statistically significant. The criterion for statistical significance for a mean difference is that P < 0.05 (5 % significance level), which is the t-test probability of obtaining a value of the test that is statistically as high or higher than the one computed from the data when in reality there is no difference between the measurements of the two methods.
Any significant mean difference and too broad 95 % tolerance ranges around this mean of two methods must be carefully interpreted. If the difference is small and the 95 % tolerance range is narrow, then the two methods show good agreement. It is important to point out that although the value of the mean difference between two instruments statistically might be significant, it should always be evaluated in terms of clinical significance as well.
If the difference is too big and clinically unacceptable, it might be necessary to compare both methods with a reference method (a tonometer, using certified gases for blood gases) or a certified reference material (NIST) to judge a clinically significant true bias or inaccuracy problem with one or both methods.
GRAPHIC PLOTS
Difference plot
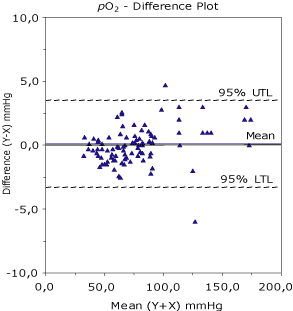
Figure 1 shows the measured method difference (Analyzer Y – Analyzer X) which is plotted (Y-axis) against a measured mean (Analyzer Y + Analyzer X) / 2) (X-axis) and presented in a difference plot (Bland-Altman plot). The mean difference and 95 % tolerance limits (UTL – Upper Tolerance Limit and LTL – Lower Tolerance Limit) for the bias are indicated by dotted lines around the line of mean difference. I recommend using statistical tolerance factors instead of the usual statistical factor of 1.96 for the 95 % confidence limits. For 100 data points, the tolerance factor is 2.23 instead of 1.96. With a decreasing number of data points the tolerance factor increases.
This plot gives a graphic presentation of the scatter of measured differences between the results from the two analyzers. By visual inspection, one might identify possible outliers as well as look for possible proportional variability at different concentration levels. No more than 1-2 % outliers are analytically and clinically acceptable for the total set of data.
Interpretation of the difference plot
If the two methods show one-to-one agreement, this graph would show a scatter around the line of mean difference and the ‘no bias’ line (zero) will be close or identical. Optimally, half of the points will be above and half of the points below this line. Any large individual difference will naturally stand out and draw attention. Therefore look for any outlying points that do not fall within the general pattern of the other data points. Inspect the plot for possible systematic constant errors and proportional systematic errors between the two methods compared.

FIG. 1. The plot shows practically no bias between the compared methods and two points outside the 95 % upper and lower tolerance limits. For values above 100 mmHg there seems to be an uneven distribution of points above the mean, indicating a possible proportional bias of Y compared with X
Interpretation of the regression analysis and plot
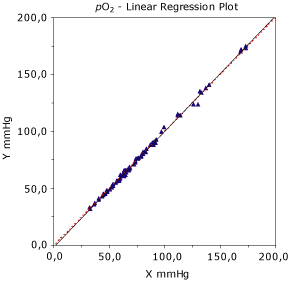
Linear regression analysis (Fig. 2) is probably the most used and misused statistics in method comparison studies. In linear regression plots one first looks at the scatter of data points around the regression (best fit) line. The standard error of estimate (sy/x) is a measure of the amount of scatter about the mean regression line when the value of X is fixed. If sy/x is large, the scatter of data points is large. Often this statistics is interpreted as a good estimate of the analytical variation of the Y method.
Key elements in the estimated regression equation are the slope and intercept (the cutoff y-value on the Y-axis). For one-to-one agreement, the slope should be close to 1.0. It is important to look for systematic “bias” or proportional errors, depending on the level of concentration compared with the line of identity. The correlation coefficient (r) is mainly useful for assessing whether the range of data is wide enough to provide a good estimate of the slope and the intercept, rather than judging the acceptability of the method.
When (r) is 0.99 or higher, simple linear regression analysis should provide reliable estimates of the slope and the intercept. If (r) is lower than 0.99, it would be better to collect additional data to expand the concentration range or consider using the I-test calculations to estimate a possible systematic error (mean difference) of the data. If (r) is lower than 0.975, we consider the linear regression analysis less reliable, and we would recommend data improvement or an alternative statistical regression analysis such as the Deming regression, which is more suitable.

FIG. 2. The plot shows the linear regression line between the two methods. The red dotted line is the identity line, which has a perfect slope of 1. When the correlation statistics (r) is less than 0.975, ordinary linear regression may not be reliable and alternative statistics may be appropriate.
Precautions of using linear regression analysis
Very often comparison studies with patient samples cover analytical ranges that are too narrow for regression analysis (e.g. for sodium, potassium, hematocrit and ionized calcium, etc.). In that case it is very often not appropriate to use statistical regression analysis but usually better to calculate the average difference and interpret the difference plot.
Comment
Should you be interested in participating in testing the analytical performance characteristics of two blood gas methods using this simple AS140 protocol and statistical presentation, you are welcome to contact the author, jhw@radiometer.dk, to set up a remote data-input approach of this article, and you will get a full report back summarizing the statistics and plots of your study.
References+ View more
- User Protocol for Evaluation of Quantitative Test Performance; Approved Guideline – NCCLS EP12-A; 2002
- Method Comparison and Bias Estimation Using Patient Samples; Approved Guideline – NCCLS EP9-A2; 2002
- Estimation of Total Analytical Error for Clinical Laboratory Methods; Approved Guideline. – NCCLS EP21-A; 2003
- Uniform Description of Claims for in Vitro Diagnostic Tests; Approved Guideline. – NCCLS EP11-A; 2002
References
- User Protocol for Evaluation of Quantitative Test Performance; Approved Guideline – NCCLS EP12-A; 2002
- Method Comparison and Bias Estimation Using Patient Samples; Approved Guideline – NCCLS EP9-A2; 2002
- Estimation of Total Analytical Error for Clinical Laboratory Methods; Approved Guideline. – NCCLS EP21-A; 2003
- Uniform Description of Claims for in Vitro Diagnostic Tests; Approved Guideline. – NCCLS EP11-A; 2002
Acute care testing handbook
Get the acute care testing handbook
Your practical guide to critical parameters in acute care testing.
Download nowScientific webinars
Check out the list of webinars
Radiometer and acutecaretesting.org present free educational webinars on topics surrounding acute care testing presented by international experts.
Go to webinars


