Printed from acutecaretesting.org
April 2004
Setting the record straight on shunt
Introduction
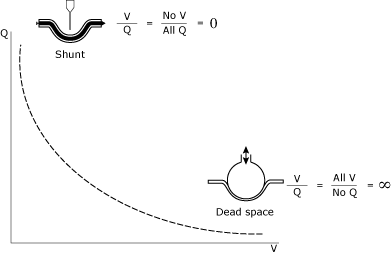
The understanding and management of V/Q relationships represents a cornerstone of intensive care unit (ICU) patient management. The V/Q relationship (Fig. 1) can be thought of as a spectrum between deadspace (infinite V/Q) and shunt (zero V/Q).
When pulmonary capillary blood is exposed to an alveolar partial pressure of oxygen (PAO2), oxygen molecules move into the plasma as dissolved O2 and continue to exert a partial pressure.
Most of these oxygen molecules immediately combine with hemoglobin and enter a state in which they no longer directly exert a partial pressure. This process continues until a partial pressure gradient between the alveolus and the plasma no longer exists, at which point the hemoglobin is maximally saturated for the blood PO2.
Even though the oxygen dissolved in the plasma represents only 1.5 % to 3 % of the total oxygen in blood, the PO2 value is important because it determines the driving force for oxygen movement into and out of the blood.
Perfect blood gas exchange would require every alveolus to be ventilated perfectly and all blood ejected from the right ventricle to traverse completely functional pulmonary capillaries. Additionally, diffusion across the alveolar/capillary membrane would have to be unimpeded.
Because all blood passing from the right ventricle to the left ventricle would reach perfect equilibrium with alveolar gas, the alveolar PO2 (PAO2) and the arterial PO2 (PaO2) would be identical.
|
FIG. 1. The mathematic and conceptual illustration of shunt and deadspace. |
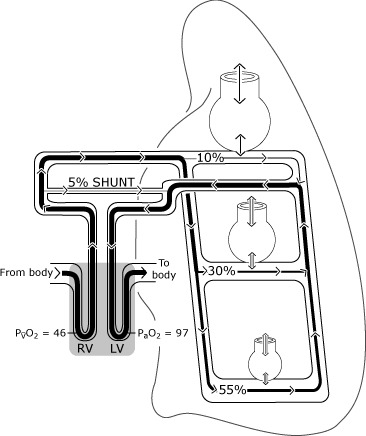
As depicted in Fig. 2, oxygenation in the normal lungs may differ from the ideal situation because distribution of perfusion is uneven.
Relatively more blood flow occurs in the gravity-dependent areas, and some venous drainage (from the bronchial, pleural and Thebesian veins) empties directly into the left side of the heart, thus bypassing (shunting) the normal oxygenation mechanism [1].
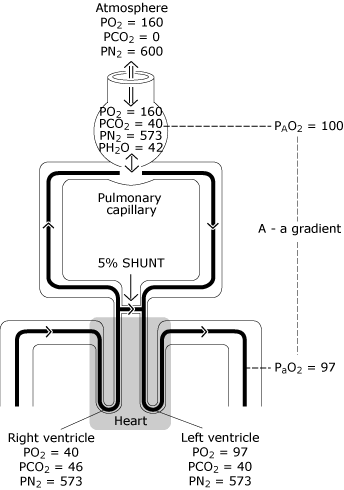
Because of this, some blood enters the left ventricle with a lower oxygen content than the blood exchanging with an ideal alveolus. Figure 3 represents the resultant lower PaO2 level compared with the calculated ideal oxygen tension.
|
FIG. 2. The normal lung has imperfect distribution of ventilation and perfusion that is primarily determined by gravity. The illustration assumes an upright posture so that the lung bases are in the gravity-dependent position. The non-gravity-dependent alveoli are larger, but receive less gas exchange (ventilation) than the gravity-dependent alveoli. Distribution of perfusion is primarily governed by gravity with approximately 55 % flowing to the gravity-dependent areas, 30 % to the mid-lung areas and 10 % to the non-gravity-dependent lung areas. PaO2 and PvO2 are expressed in mmHg (kPa = mmHg × 0.133); RV = right ventricle; LV = left ventricle. Reproduced with permission from Elsevier Health Sciences. |
|
FIG. 3. The normal lung has imperfect distribution of ventilation, imperfect distribution of perfusion and some minimal degree of intrapulmonary shunting. The result is a decrease in PO2 from the calculated ideal alveolar value (PAO2) to the measured systemic arterial blood value (PaO2). This PO2 difference is known as “the alveolar-to-arterial oxygen tension gradient” [P(A-a)O2]. PO2 = oxygen tension expressed in mmHg; PCO2 = carbon dioxide tension expressed in mmHg; PN2 = nitrogen tension expressed in mmHg; PH2O = water vapor tension expressed in mmHg. (kPa = mmHg × 0.133). Reproduced with permission from Elsevier Health Sciences. |
Shunt and hypoxemia
Anatomic shunting is defined as blood that goes from the right side to the left side of the heart without traversing pulmonary capillaries. Capillary shunting is defined as blood that goes from the right side of the heart to the left side of the heart via pulmonary capillaries that are adjacent to unventilated alveoli.
Both cases allow blood to enter the left-sided circulation without an increase in oxygen content. This is referred to as zero V/Q, or true shunting, because the blood has had no opportunity for gas exchange with functional alveoli.
An example of shunting in the clinical setting is the gas exchange abnormalities seen in pneumonia by the release of endotoxin that leads to cellular edema and vasoconstriction [2].
Shunting and hypoxemia are not synonymous terms, nor do they have linear relationships. The hypoxemic effect of any shunt will depend not only on the size of the shunt but also on oxygenation status of the venous blood that shunts (SVO2). A small shunt with a low SVO2 may have profound hypoxemic effects, whereas a large shunt with a high SvO2 will cause less significant hypoxemia.
It can be stated unequivocally that when hypoxemia exists, some degree of shunting (intrapulmonary or intracardiac) must be present; however, the effect of shunt on the PaO2 depends greatly on cardiovascular function and metabolic rate. Arterial hypoxemia is a result of lung function, cardiovascular function and metabolism.
Assessment of the lungs as an oxygenator is essential in the care of many patients requiring cardiopulmonary supportive care. Calculation of intrapulmonary shunting represents the best available means of delineating the extent to which the pulmonary system contributes to hypoxemia.
Intrapulmonary shunt
As stated previously, the intrapulmonary shunt is defined as that portion of the cardiac output entering the left side of the heart without undergoing perfect gas exchange with completely functional alveoli. Intrapulmonary shunt can be divided into three components.
- Anatomic shunting has previously been described as blood that enters the left side of the heart without traversing pulmonary capillaries. In addition to normal anatomic shunting from bronchial, pleural and Thebesian veins, anatomic shunting can be increased by vascular lung tumors and right-to-left intracardiac shunts.
- Capillary shunting is caused when blood traverses pulmonary capillaries but does not equilibrate with alveolar gas due to pathologic processes such as atelectasis, pneumonia and acute lung injury.
- Venous admixture occurs when blood equilibrates with an alveolar PO2 that is less than ideal as in situations of low V/Q [3, 4]. Because venous admixture is not true shunt, this sometimes leads to confusion. The sum of anatomic and capillary shunts is most commonly termed zero V/Q or true shunt. Venous admixture is often referred to as low V/Q or “shunt effect”. Physiologic shunt in normal or non-diseased lungs is a measurement of normal intrapulmonary shunt. In the setting of pulmonary pathology, physiologic shunt primarily represents the severity of the disease state.
The shunt equation
The equation used to calculate the shunt portion of the cardiac output assumes that the non-shunting gas perfectly oxygenates by exchanging with perfect alveolar gas.
Although the intrapulmonary shunt concept does not reflect regional relationships, as does the ventilation perfusion concept, it does reflect the degree to which the lung deviates from the ideal as an oxygenator of pulmonary blood.
It is this quantitative ability to look at the lungs as an oxygenator that makes this measurement unique and valuable in the clinical setting. This review uses the term physiologic shunt in reference to the intrapulmonary shunt calculated with the patient breathing less than 100 % oxygen.
The derivation of the shunt equation comes from the concepts of Fick. In 1870, he introduced the classic relationship that the quantity of oxygen available for tissue utilization per unit time includes the arterial oxygen content (CaO2) multiplied by the quantity of arterial blood presented to the tissues per unit time (i.e., cardiac output, Qt).
Equation 1:
Oxygen available = (Qt)(CaO2)
Oxygen returned to the lungs includes the cardiac output (Qt) multiplied by the mixed venous oxygen content (CVO2).
Equation 2:
Oxygen returned = (Qt)(CvO2)
Oxygen consumption per unit time (VO2) should reflect the oxygen that has been extracted from the blood in that time period.
Equation 3:
VO2 = (Qt)(CaO2) – (Qt)(CvO2)
Equation 3 then can be rewritten as what is classically described as the Fick Equation.
Equation 4:
VO2 = Qt(CaO2 – CvO2)
Rearranged algebraically, Equation 4 can be expressed as a function of cardiac output.
Equation 5:
Qt = VO2/(CaO2 – CvO2)(10)
To express the cardiac output in liters per minute the oxygen
difference must be
multiplied by a factor of 10.
Two other equations with which one must become familiar are the classic shunt equation (Equation 6), which describes the ratio between shunted cardiac output and total cardiac output (QS/Qt). It is measured with the patient breathing 100 % oxygen.
Equation 6:
QS/Qt = (CcO2 – CaO2)/(CcO2 – CvO2)
The physiologic shunt equation (QSP/Qt) is another way of expressing Equation 6 when measured with the patient breathing less than 100 % oxygen and some venous admixture exists. Hence the physiologic shunt equation is:
Equation 7:
QSP/Qt = (CcO2 – CaO2)/ (CcO2 – CvO2)
The QSP/Qt has the advantage of being derived as a ratio so that no absolute measure of cardiac output is required. In this form, the equation clearly demonstrates that as the shunted cardiac output approaches zero, the arterial oxygen content must approach the theoretical end pulmonary capillary oxygen content.
As long as some portion of the cardiac output does not perfectly exchange with perfect alveoli, the arterial oxygen content must be less than the ideal end pulmonary capillary oxygen content.
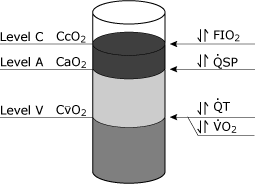
The implications of the physiologic shunt equation may be conceptualized by considering the oxygen content terms (CcO2, CaO2, CvO2) as entities that can be poured into a container (Fig. 4). Certain factors, such as hemoglobin concentration, can affect all three levels.
The most important clinical variable affecting CcO2 is FiO2, whereas both total cardiac output and oxygen consumption affect CvO2. Changes in the physiologic shunt affect CaO2.
|
FIG. 4. Schematic representation of blood oxygen levels that could theoretically be obtained from three separate sites in the cardiovascular system. Level C represents the end pulmonary capillary blood oxygen content (CcO2). Level A represents the systemic arterial blood oxygen content (CaO2), and Level V represents the mixed venous (pulmonary artery) blood oxygen content (CvO2). The most common clinical variables that specifically affect these various levels is shown: Level C is most commonly affected by changes in FIO2 (inspired oxygen fraction), Level A is specifically affected by changes in the physiological shunt (QSP), Level V is specifically affected by both the total cardiac output (QT) and the rate of oxygen consumption (VO2). Reproduced with permission from Elsevier Health Sciences. |
The numerator of the shunt equation is represented by differences in CcO2 and CaO2. The denominator of the equation is represented by the differences in CcO2 and CvO2.
Changes of unequal magnitude among these three levels will change the ratio, which is equivalent to changes in the physiologic shunt calculation.
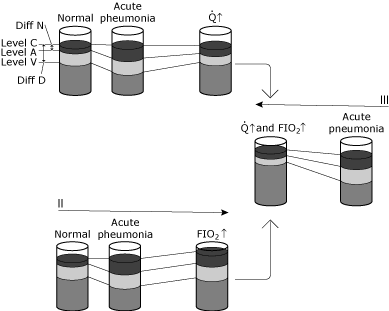
If a patient develops fulminant right-, middle- and lower-lobe consolidation, the arterial and pulmonary artery blood gas measurements would reveal a clinical picture as reflected in Fig. 5.
The arterial oxygen tension and content are significantly decreased due to a large intrapulmonary shunt. If the cardiac output remains unchanged and the arterial-mixed venous oxygen difference does not change, then the CvO2 must also decrease.
Because of the change of unequal magnitude, the physiologic shunt will greatly increase secondary to hypoxemia.
|
FIG. 5. Schematic representation of changes in blood oxygen levels under various conditions. The purpose of this illustration is to conceptualize the difference between physiologic shunting and the hypoxemic effect of physiologic shunting. I, II, and III illustrate changes in a normal individual who contracts pneumonitis that causes a significant increase in intrapulmonary shunting without any compensatory physiologic change. The status from normal to acute pneumonia shows: no change in Level C because ventilation and FIO2 are unchanged, a specific drop in Level A due to increased shunting created by the pneumonia, and a drop in Level V because the AV content difference is unchanged (cardiac output and oxygen consumption unchanged). Since Diff N has increased to a greater degree than Diff D, the calculated shunt increases. Condition 1 shows an increased cardiac output (Q↑) in response to the acute hypoxemia. Level C remains unchanged since neither ventilation nor FIO2 has been altered. The AV content difference has narrowed because the cardiac output has increased, while oxygen consumption remains unchanged. The increase in Level V results in a new dynamic equilibrium in which Level A is also increased. Note that the relationship between Diff N and Diff D is only slightly altered. Thus, Level A (and therefore the PaO2) has increased with little change in the calculated shunt. In this instance, the compensation for hypoxemia is cardiovascular; the intrapulmonary shunt has not changed. Condition II shows an increased inspired oxygen concentration (FIO2↑). Level C increases, while AV content difference remains unchanged (cardiac output and oxygen consumption unchanged). A new dynamic equilibrium results in Level A (and therefore the PaO2 increasing). The relationship between Diff N and Diff D is only slightly altered. Level A (and therefore PaO2) has increased with little change in the calculated shunt. In this instance, compensation for hypoxemia is via oxygen therapy; the intrapulmonary shunt is essentially unchanged. Condition III shows both cardiac output and inspired oxygen concentration changes (Q↑ and FIO2↑). Note the profound increase in Level A (and therefore PaO2) with little alteration in the Diff N/Diff D. Reproduced with permission from Elsevier Health Sciences. |
Severe hypoxemia will usually lead to an increase in cardiac output. This results in a decrease in the arterial-venous oxygen content difference as reflected by an increase in CvO2.
A new equilibrium will result in an increase of CaO2 without a change in ratio (QSP/Qt). The arterial PO2 improves greatly, without a significant change in physiologic shunt secondary, due to an improved cardiac output.
If the assumption is made that supplemental oxygen is administered to this patient while the cardiac output remains unchanged, CcO2 is increased secondary to an increased alveolar PO2. Since the physiologic shunt remains the same and the arterial-venous oxygen content difference remains the same, a new equilibrium results in CaO2 and CvO2 increasing.
Finally, the circumstances are changed to depict a patient with oxygen therapy and an increase in cardiac output. CaO2 increases because both CcO2 and CvO2 increase. Hypoxemia improves while the ratio (QSP/QT) remains unchanged.
The physiologic shunt calculation can reliably reflect the degree of gas exchange attributable to intrapulmonary disease or intracardiac shunting regardless of other factors that may also play a role.
Because multiple causes of hypoxemia are frequently encountered in the critically ill, the ability to quantify the degree of intrapulmonary pathophysiology is an extremely important tool.
How to determine shunt
The intrapulmonary shunt can be measured only when both arterial and pulmonary arterial blood samples are available and the FIO2 is constant. Catheters inserted into the central venous circulation that lie just above the superior vena cava-right atrial junction are largely inadequate for shunt determinations because blood drawn from this position will not contain the significantly desaturated blood from the coronary sinus or inferior vena cava.
Blood samples taken from the right atrium exhibit significant oxygen content variation because of channeling of blood flow and movement of the catheter tip. Catheter tips in the right ventricle may cause ventricular ectopy and yield variable oxygen content samples. Mixed venous samples are obtained from a pulmonary artery catheter.
Normal values are a mean partial pressure of O2 in mixed venous blood of 40 mmHg (SVO2 75 %).
If at all possible, the patient should not be stimulated or disturbed for several minutes before sampling. Care should be taken to avoid airway suctioning and other procedures during this time period. The arterial and mixed venous sample should be drawn simultaneously. Care must be taken to avoid sampling errors, particularly from the pulmonary artery catheter.
When blood samples are drawn from the pulmonary artery, the sample must be drawn slowly because rapid aspiration can result in pulmonary capillary blood being mixed with pulmonary artery blood, causing dramatic increases in oxygen content [5].
Rapid flow of intravenous fluids via a central venous catheter or more proximal PA catheter ports can contaminate blood drawn from the distal port of the PA catheter and cause erroneous hemoglobin determinations and oxygen content calculations.
The CaO2 and CvO2 values are calculated. There should not be more than 1 g/dL difference between the hemoglobin content of the two samples. An average of the two is recommended for the calculations if the difference is more than 0.5 g/dL.
It is recommended that carboxyhemoglobin be measured or assumed to be 1.5 % [6]. The CcO2 value is then calculated by using the average or arterial hemoglobin content and assuming the partial pressure of O2 in the capillary bed is equal to the PaO2. If the PaO2 is greater than 150 mmHg, all available hemoglobin is assumed to be saturated.
True shunt is refractory to oxygen therapy. This results in what is termed “refractory hypoxemia”. Because refractory hypoxemia does not respond to oxygen therapy, other means should be sought to improve arterial oxygenation. These may include treatment of the underlying pathology, application of Positive End Expiratory Pressure (PEEP) therapy or increasing oxygen content to maintain acceptable oxygen delivery.
The most common causes of refractory hypoxemia are divided into cardiac and pulmonary. The most common pulmonary causes are consolidated pneumonitis, atelectasis, neoplasm, or the acute respiratory distress syndrome/acute lung injury.
Shunt and PEEP
Since true shunt is not oxygen responsive, positive end expiratory pressure or PEEP therapy may be applied to the diseased lungs to help reduce QSP/QT. Among the physiologic responses seen with PEEP are improved oxygenation, increased functional residual capacity, improved lung compliance and a decrease in shunting.
The decrease in shunting seen with PEEP is most classically attributed to alveolar recruitment or an increase in functional residual capacity secondary to the inflation of previously collapsed alveoli [5, 7].
Gattinoni has described using computed tomography the regional gas distribution in tissues during the titration of PEEP [8]. These studies have confirmed the classic inflection point in the gas/tissue curve, which is consistent with alveolar recruitment [8].
The response of PEEP titration varies not only with the type of lung pathology but also with the region of lung studied. More dependent lung regions undergo greater degrees of alveolar recruitment while less dependent lung regions tend to experience greater increases in alveolar volume without recruitment, and regions of lung that are non-responsive to PEEP are equally distributed throughout the lung.
Other methods of improving oxygenation include prone positioning, which increases the homogeneity of the intrapulmonary process and improves ventilation [9, 10].
References+ View more
- Ravin MB, Epstein RM, Malm JR. Contribution of the thebesian veins to the physiologic shunt in anesthetized man. J Appl Physio 1965; 20: 1148-52
- Walmrath D, Pilch J, Scharmann M, Grimminger F, Seeger W. Severe VA/Q mismatch in perfused lungs evoked by sequential challenge with endotoxin and E. coli hemolysin. Journal of Applied Physiology 1994; 76,3: 1020-30
- Riley RL, Cournanc A. Analysis of factors affecting partial pressures of oxygen and carbon dioxide in gas and blood of lungs: Theory. J Appl Physiol 1951; 4: 77-101
- Riley RL, Permutt S. Venous admixture component of the AaPO2 gradient. J Appl Physiol 1973; 35: 430-31
- Kumar A, Falke KJ, Geffin B, Aldredge CF, Laver MB, Lowenstein E, Pontoppidan H. Continuous positive-pressure ventilation in acute respiratory failure. N Engl J Med 1970; 238,26: 1430-36
- Cane RD, Shapiro BA, Harrison RA, et al. Minimizing errors in intrapulmonary shunt calculations. Crit Care Med 1980; 8: 294-97
- McIntyre RW, Laws AK, Ramachandran PR. Positive expiratory pressure plateau: improved gas exchange during mechanical ventilation. Can Anaesth Soc J 1969; 16,6: 477-86
- Gattinoni L, Pesenti A, Bombino M, Baglioni S, Rivolta M, Rossi F. Relationships between lung computed tomographic density, gas exchange, and PEEP in acute respiratory failure. Anesthesiology 1988; 69,6: 824-32
- Mure M, Domino KB, Kindahl SG, Hlastal MP, Altemeier WA, Glanny RW. Regional ventilation-perfusion distribution is more uniform in the prone position. J Appl Physiol 2000; 88,3: 1076-83
- Reinprecht A, Greher M, Wolfsberger S, Dietrich W, Illevich UM, Gruber A. Prone position in subarachnoid hemorrhage patients with acute respiratory distress syndrome: effects on cerebral tissue oxygenation and intracranial pressure. Crit Care Med 2003; 31,6: 1931-38
References
- Ravin MB, Epstein RM, Malm JR. Contribution of the thebesian veins to the physiologic shunt in anesthetized man. J Appl Physio 1965; 20: 1148-52
- Walmrath D, Pilch J, Scharmann M, Grimminger F, Seeger W. Severe VA/Q mismatch in perfused lungs evoked by sequential challenge with endotoxin and E. coli hemolysin. Journal of Applied Physiology 1994; 76,3: 1020-30
- Riley RL, Cournanc A. Analysis of factors affecting partial pressures of oxygen and carbon dioxide in gas and blood of lungs: Theory. J Appl Physiol 1951; 4: 77-101
- Riley RL, Permutt S. Venous admixture component of the AaPO2 gradient. J Appl Physiol 1973; 35: 430-31
- Kumar A, Falke KJ, Geffin B, Aldredge CF, Laver MB, Lowenstein E, Pontoppidan H. Continuous positive-pressure ventilation in acute respiratory failure. N Engl J Med 1970; 238,26: 1430-36
- Cane RD, Shapiro BA, Harrison RA, et al. Minimizing errors in intrapulmonary shunt calculations. Crit Care Med 1980; 8: 294-97
- McIntyre RW, Laws AK, Ramachandran PR. Positive expiratory pressure plateau: improved gas exchange during mechanical ventilation. Can Anaesth Soc J 1969; 16,6: 477-86
- Gattinoni L, Pesenti A, Bombino M, Baglioni S, Rivolta M, Rossi F. Relationships between lung computed tomographic density, gas exchange, and PEEP in acute respiratory failure. Anesthesiology 1988; 69,6: 824-32
- Mure M, Domino KB, Kindahl SG, Hlastal MP, Altemeier WA, Glanny RW. Regional ventilation-perfusion distribution is more uniform in the prone position. J Appl Physiol 2000; 88,3: 1076-83
- Reinprecht A, Greher M, Wolfsberger S, Dietrich W, Illevich UM, Gruber A. Prone position in subarachnoid hemorrhage patients with acute respiratory distress syndrome: effects on cerebral tissue oxygenation and intracranial pressure. Crit Care Med 2003; 31,6: 1931-38
May contain information that is not supported by performance and intended use claims of Radiometer's products. See also Legal info.
Acute care testing handbook
Get the acute care testing handbook
Your practical guide to critical parameters in acute care testing.
Download nowRelated webinar
Evolution of blood gas testing Part 1
Presented by Ellis Jacobs, PhD, Assoc. Professor of Pathology, NYU School of Medicine.
Watch the webinar


