Printed from acutecaretesting.org
May 2016
Statistical analysis in method comparison studies part one


SummaryThis first of two articles on method comparison studies gives some key concepts related to the design of the method comparison study, data analysis and graphical presentation, stressing the importance of a well-designed and carefully planned experiment using adequate statistical procedures for data analysis when carrying out a method comparison.
Introduction
One of the important aspects of the method verification is the assessment of method trueness.
Method trueness can be assessed either by following the CLSI EP15-A2 standard, which defines procedure of the verification of performance for precision and trueness, or the CLSI EP09-A3 standard, which provides guidance on how to estimate the bias by comparison of measurement procedures using patient samples [1,2].
The CLSI EP09-A3 standard also defines several statistical procedures which can be used to describe and analyze the data.
The choice of correct statistical procedures for data analysis and knowledge about how to interpret the results of statistical analysis is of key importance for proper assessment of the method trueness.
This article provides the insight into the proper design of the method comparison study and some basic considerations about initial steps in data analysis and graphical presentation (scatter and difference plots).
The following article will address statistical methods used in method comparison studies (Passing-Bablok and Deming regression).
Study design
Method comparison study assesses the degree of agreement of the method currently used in the laboratory and the new method.
Method comparison study is done whenever a new method that replaces the existing method in the laboratory is introduced.
The aim of the method comparison experiment is to evaluate the possible difference between these methods (the old one and the new one) and to ensure that the change of methods is not going to affect patient results and medical decisions based on these.
At least 40 and preferably 100 patient samples should be used to compare two methods.
Larger sample size is preferable to identify unexpected errors due to interferences or sample matrix effects.
Samples should be selected with great care, taking into account the following:
-
cover the entire clinically meaningful measurement range
-
whenever possible, perform duplicate measurements for both current and new method to minimize random variation effect
-
randomize the sample sequence to avoid carry-over effect
-
analyze samples within the period of their stability (preferably within the time span of 2 hours)
-
analyze samples on the day of the blood sampling
-
measure samples over several days (at least 5) and multiple runs to mimic the real-world situation
Acceptable bias should be defined before the experiment and selection of the performance specifications should be based on one of the three models in accordance with the Milano hierarchy [3]:
-
Based on the effect of analytical performance on clinical outcomes (direct or indirect outcome studies)
-
Based on components of biological variation of the measurand
-
Based on state-of-the-art
Which statistical tests should not be used in method comparison study?
The use of correlation analysis and t-test are quite commonly used in the literature as the statistical methods of the first choice when assessing the comparability of two methods.
However, it should be emphasized that neither correlation analysis nor the t-test is adequate and appropriate for that purpose.
Correlation analysis provides evidence for the linear relationship (i.e. association) of two independent parameters, but it can neither be used to detect proportional nor constant bias between two series of measurements.
The degree of association is assessed by the respective correlation coefficient (r) and coefficient of determination (r2). Coefficient of determination defines the degree to which data fit into the linear regression model (how well data can be explained by the linear relationship).
The greater the r2 is, the higher is the association.
The value of correlation coefficient (r) ranges from –1 to +1. The association can be positive (r>0) and negative (r<0). Negative correlation between two parameters indicates that the increase of one parameter is associated with the decrease of the other.
Positive association is present when the increase of one parameter is concomitant with the increase of the other parameter.
However, the existence of positive correlation does not mean that the values of these two parameters are comparable, as is shown in the below example (Table I):
TABLE I: Glucose measurements by two different methods in a series of samples (N=10)
| Sample number | 1 | 2 | 3 | 4 | 5 | 6 | 7 | 8 | 9 | 10 |
| Glucose measured by Method 1 (mmol/L) | 1 | 2 | 3 | 4 | 5 | 6 | 7 | 8 | 9 | 10 |
| Glucose measured by Method 2 (mmol/L) | 5 | 10 | 15 | 20 | 25 | 30 | 35 | 40 | 45 | 50 |
Let us assume that glucose is measured by one instrument (Method 1) with one method and on the other instrument with another method (Method 2) in 10 patients.
With the increase of the glucose concentration measured by Method 1 there is an unquestionable increase of glucose concentration measured by Method 2.
However, there is a large bias in these two methods and it is obvious that these two methods are not comparable, although the coefficient of correlation (r) for these two methods is 1.00 (P<0.001).
Coefficient of correlation shows that these two sets of measurements are in a linear relationship, which is obvious if we look at Fig. 1. What the correlation analysis did not detect is the proportional bias between glucose measured by Method 1 and Method 2.
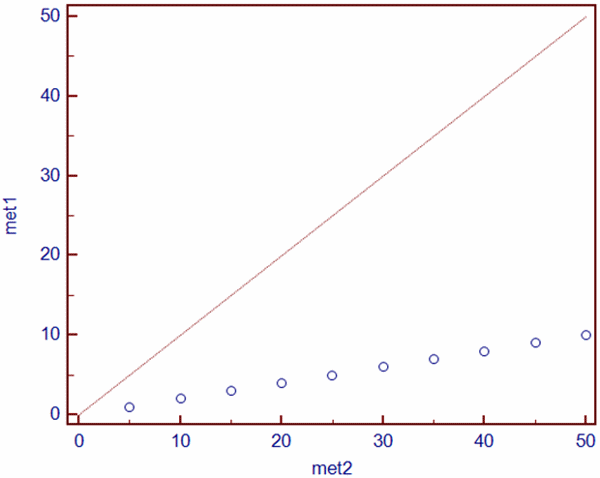
FIG. 1: Scatter diagram showing the linear relationship between Method 1 (met1) and Method 2 (met2) for glucose measurement (dataset from Table I). Red line shows line of equality.
Another common mistake is to use t-test to evaluate method comparability. Neither paired t-test nor t-test for independent samples can reliably assess the comparability of two series of measurements.
Let us now again assume that glucose is measured by one instrument (Method 1) with one method and on the other instrument with another method (Method 2) in five patients and the results are presented in the table below (Table II):
TABLE II: Glucose measurements by two different methods in a series of five samples
| Sample number | 1 | 2 | 3 | 4 | 5 |
| Glucose measured by Method 1 (mmol/L) | 1 | 2 | 3 | 4 | 5 |
| Glucose measured by Method 2 (mmol/L) | 5 | 4 | 3 | 2 | 1 |
If we test these two sets of data with independent t-test, it will show us there is no difference between these two sets of measurements (P<0.001). This is obviously not true.
Glucose measured by Method 1 and Method 2 are surely not comparable. So, why is independent t-test not able to detect this? Independent t-test actually only detects whether two independent sets of measurements have the same or similar average values.
The averages of five measurements with Method 1 and Method 2 are indeed identical (3 mmol/L) and this is why t-test did not detect the difference between these two sets of measurements.
Paired t-test is used to assess whether there is a difference between paired measurements.
As measurements of one parameter by two different methods (Method 1 and Method 2) are paired measurements, paired t-test is obviously a better choice to detect the difference between them.
However, t-test will detect a difference which does not necessarily need to be a clinically meaningful difference, if the size of the sample is large enough.
On the other hand, if the size of the sample is too small, paired t-test will not detect a difference between two sets of measurements even if this difference is large and clinically meaningful, as is shown in the below example (Table III).
According to paired t-test the two series of five glucose measurements measured by two different methods, are not statistically different (P=0.208), although a mean difference between the two sets of measurements is greater than clinically acceptable (-10.8%).
TABLE III: Glucose measurements by two different methods in a series of five samples
| Sample number | 1 | 2 | 3 | 4 | 5 |
| Method 1 (mmol/L) | 2 | 4 | 6 | 8 | 10 |
| Method 2 (mmol/L) | 3 | 5 | 7 | 9 | 9 |
Scatter plots
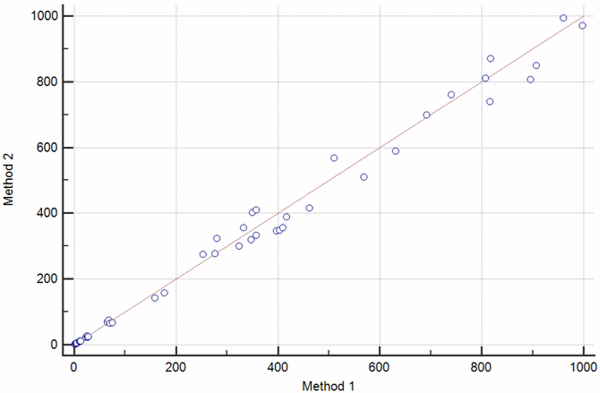
Scatter plots (or scatter diagrams) help in describing the variability in the paired measurements throughout the range of measured values.
Each pair of measurements is presented with one point, which is defined by the value on the x axis (usually the reference method) against the measurement with the second method (usually the comparison method) on the y axis (Fig. 2).
It is advisable, as already mentioned, to perform multiple (duplicate or even triplicate) measurements to minimize random variation effects.
If a measurement of a certain analyte has been done in duplicate, a mean of two measurements should be used in plotting the data.
In case three or more measurements have been done for one analyte, a median should be used instead of the average value.
a
b
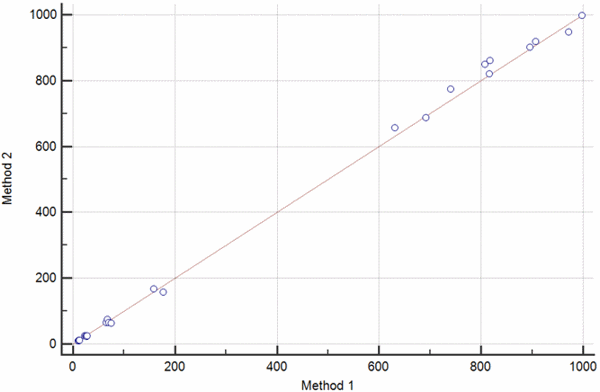
FIG. 2: The scatter diagram shows the set of paired values for βHCG measured on two different instruments. a) Scatter diagram showing a set of measurement obtained over the broad measurement range of 0-1000 IU/L. b) Scatter diagram showing the results of an invalid method comparison experiment with a gap between βHCG values 200-600 IU/L.
Problems detected with the scatter plot should be dealt with before any other analysis is done.
In case the data do not cover the entire measurement range, as showed in Fig. 2b, one should go back and perform additional measurements in order to fill this gap.
Difference plots
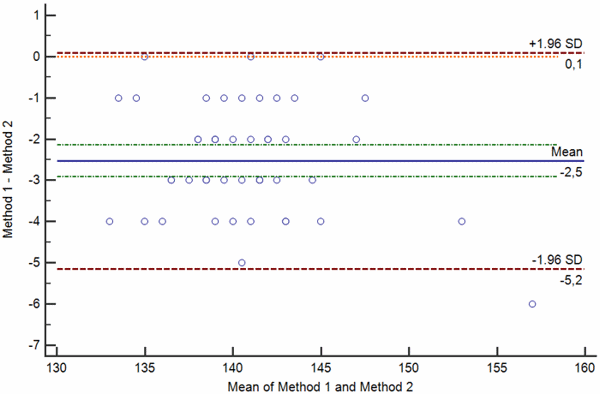
Difference plots are commonly used graphical methods aimed at describing the agreement between two measurement methods in method comparison studies [4].
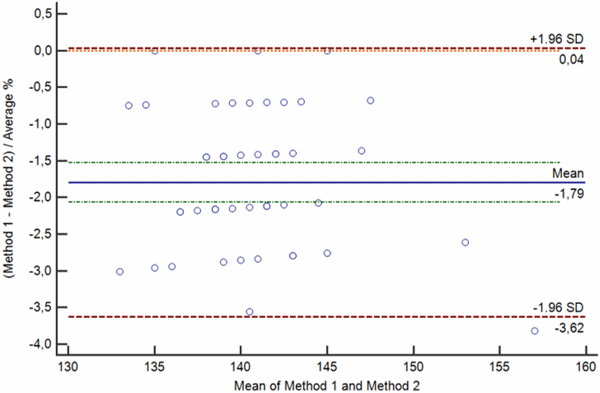
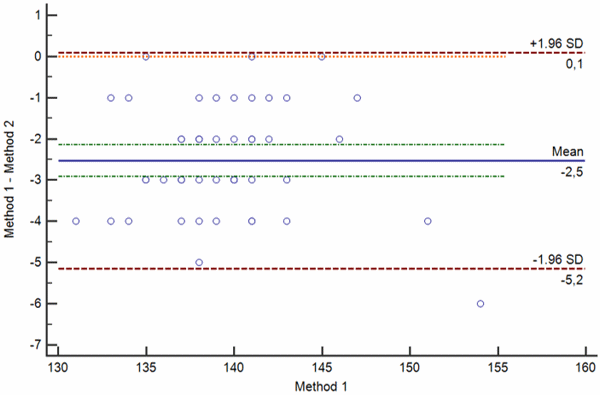
Difference plots may be constructed so that a) the differences, ratios or percentages between the methods are plotted on the y axis against the average of the methods on the x axis (Bland-Altman plot) or so that b) the differences between the methods are plotted on the y axis against one of two methods on the x axis (Krouwer plot).
Bland-Altman plots are used when none of the two measurement methods are reference methods or the so-called “gold standard” methods, whereas Krouwer plots are used when the method plotted on the x axis is a reference method.
Difference plots are used to assess the existence of a significant bias between the two measurements. If there is a significant bias, difference plots may help to assess how bias relates to the average value of the two measurements.
If one of the measurements is the reference method or the gold standard, difference plot may help to assess how the bias relates to the true value of the analyte under investigation. Examples of Bland-Altman and Krouwer plots are shown on Figs. 3 a-d.
a
b
c
d
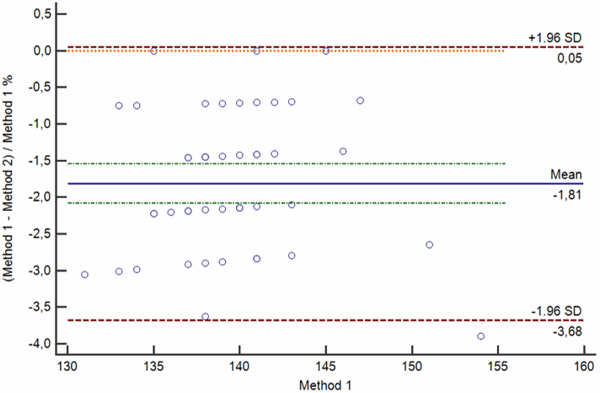
FIG. 3: Various types of difference plot. a-b) Bland-Altman plots showing the difference (a) and percentage of the difference (b) between the methods plotted on the y axis against the average of the methods on the x axis. c-d) Krouwer plots showing the differences between the methods (c) and percentage of the difference (b) between the methods plotted on the y axis against one method (the reference method).
Legend: Solid blue horizontal line shows the mean difference, dotted green line shows the 95 % confidence interval of the mean difference, red dotted lines show limits of agreement (±1.96 standard deviation of the differences) and thin red dotted line shows the line of equality (zero difference).
As already stated above, difference plots are helpful in determining whether there is some bias between the methods and if the bias exists. They also help in evaluating how bias relates to the average value of the two measurements.
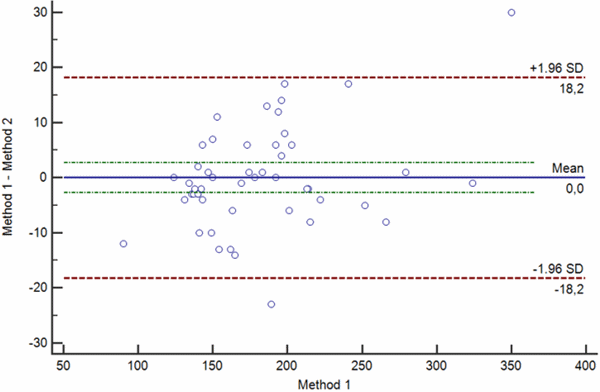
Bias between two measurements can be random, proportional and constant. Bland-Altman plots showing random, proportional and constant bias are presented in Figs. 4 a-c.
a
b
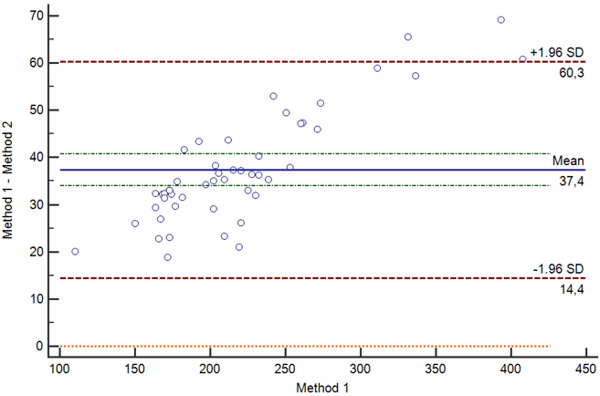
c
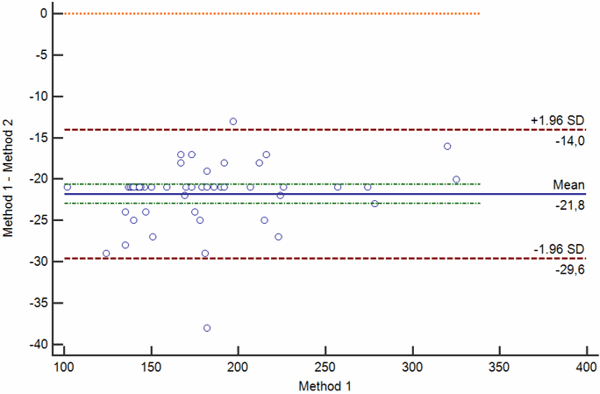
Confidence limits of the bias depend on the number of measurements and the variability of the measurements. The greater the number of measurements is, the narrower is the 95 % confidence interval of the mean difference.
Also, the greater the variability of the measurements, the broader will be the 95 % confidence interval of the mean difference.
When interpreting the bias, one also needs to keep in mind that bias is statistically significant only if the line of equality (zero difference) is not within the 95 % confidence limits of the bias.
Of course, statistical significance of the bias does not provide evidence for its clinical significance. As already pointed out in the beginning of this article, clinical significance can only be assessed by evaluating the difference with the acceptance criteria.
Conclusions
Method comparison should be based on the carefully planned study. Properly designed experiment and adequate statistical procedures for data analysis are the key to valid method comparison and reliable assessment of method trueness.
When performing a method comparison, below requirements must be kept in mind:
-
Correlation analysis and t-test are not appropriate methods for analyzing the comparability of measurements.
-
Before data analysis, paired measurements should be graphically presented using the scatter plot. Scatter plot enables that outliers are detected as well as interval of values which is not covered by the analysis. Before any further analysis, additional experiments should be done to ensure that the entire clinically meaningful measurement range is covered.
-
To detect the existence of bias, difference plots are used (Bland-Altman and Krouwer plots). Difference plots may detect the existence of significant bias between the two measurements and how it relates to the average value of the two measurements.
-
When interpreting the bias, one must always take into account the clinically meaningful limits which must be set before the experiment and should be based on the Milano hierarchy (clinical outcomes, biological variation or state-of-the-art) [3].
The following article (Statistical analysis in method comparison studies – Part two) will address the proper use of statistical methods used in method comparison studies (Passing-Bablok and Deming regression) by providing practical examples and guidance on how to perform the analysis and how to interpret results obtained by the statistical analysis.
References+ View more
- Clinical and Laboratory Standards Institute. User Verification of Performance for Precision and Trueness; Approved Guideline—Second Edition. CLSI documen EP15-A2. Clinical and Laboratory Standards Institute, Wayne, Pennsylvania, USA, 2005.
- Clinical and Laboratory Standards Institute. Measurement procedure comparison and bias estimation using patient samples; approved guideline —Third Edition. CLSI document EP09-A3. Clinical Laboratory Standards Institute, Wayne, PA, USA, 2013.
- Sandberg S, Fraser CG, Horvath AR, Jansen R, Jones G, Oosterhuis W, Petersen PH, Schimmel H, Sikaris K, Panteghini M. Defining analytical performance specifications: Consensus Statement from the 1st Strategic Conference of the European Federation of Clinical Chemistry and Laboratory Medicine. Clin Chem Lab Med 2015; 53, 6: 833-35.
- Giavarina D. Understanding Bland Altman analysis. Biochem Med 2015; 25, 2: 141-51.
References
- Clinical and Laboratory Standards Institute. User Verification of Performance for Precision and Trueness; Approved Guideline—Second Edition. CLSI documen EP15-A2. Clinical and Laboratory Standards Institute, Wayne, Pennsylvania, USA, 2005.
- Clinical and Laboratory Standards Institute. Measurement procedure comparison and bias estimation using patient samples; approved guideline —Third Edition. CLSI document EP09-A3. Clinical Laboratory Standards Institute, Wayne, PA, USA, 2013.
- Sandberg S, Fraser CG, Horvath AR, Jansen R, Jones G, Oosterhuis W, Petersen PH, Schimmel H, Sikaris K, Panteghini M. Defining analytical performance specifications: Consensus Statement from the 1st Strategic Conference of the European Federation of Clinical Chemistry and Laboratory Medicine. Clin Chem Lab Med 2015; 53, 6: 833-35.
- Giavarina D. Understanding Bland Altman analysis. Biochem Med 2015; 25, 2: 141-51.
May contain information that is not supported by performance and intended use claims of Radiometer's products. See also Legal info.


Acute care testing handbook
Get the acute care testing handbook
Your practical guide to critical parameters in acute care testing.
Download now
Scientific webinars
Check out the list of webinars
Radiometer and acutecaretesting.org present free educational webinars on topics surrounding acute care testing presented by international experts.
Go to webinars