Printed from acutecaretesting.org
April 2008
The Role of Physician Feedback in Improving Lab Utilization
INTRODUCTION
Group Health is an integrated, multidisciplinary healthcare delivery system located in Washington State and Northern Idaho. Our laboratory serves a network of 22 outpatient family practice clinics in Western Washington, including Seattle.
The family practice group is comprised of 246 family practice doctors and delivers care to 326,000 consumers. The entire network is linked by a computerized electronic medical record (EMR) and all providers enter their laboratory orders on the computer.
The EMR is directly linked to the laboratory computer system (LCS) which accepts the order, instructs the phlebotomists on what to draw and delivers the test result to the EMR as soon as it is available on the instrument.
OUR STORY
In 2001, a benchmark study of our laboratory system suggested that our providers order more lab tests than our peers (FIGURE 1).
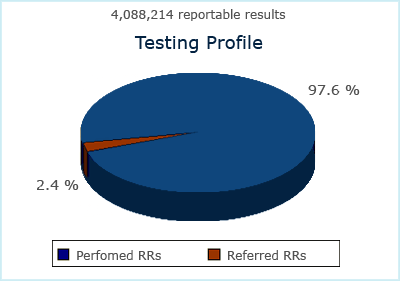
Further analysis showed the majority of lab tests were common routine tests such as blood glucose, urinalysis, and the complete blood profile that we performed ourselves. The esoteric tests that we sent out to reference laboratories comprised only 2% of our total test volume (FIGURE 2).
Primary care providers, not specialists, ordered 60 to 70% of tests. The laboratory, with the assistance of selected primary care teams, reviewed 255 randomly selected charts at five clinics. Each chart was reviewed by either a pathologist or primary care physician who completed an evaluation sheet.
From this review we found that: 28% of tests were ordered as part of a periodic health assessment, 21% of tests did not link to an investigation, 15% were recurring tests at inappropriate intervals, and 18% were panel tests when a specific test would have been sufficient.
Our chart review findings were very similar to earlier findings reported elsewhere and in an earlier study done here [1,2]. The U.S. Public Health Service Task Force national guideline for the periodic health exam recommends very few laboratory tests [3,4].
FIGURE 1: Outpatient Tests Per Encounter
This is a graph from the benchmark study done in 2001. The numbers of outpatient tests per encounter counted in our laboratory ("Lab Service") is compared to the 25th, 50th, and 75th percentile levels of our peer group. The composition of the peer group was proprietary information and was not known to us.
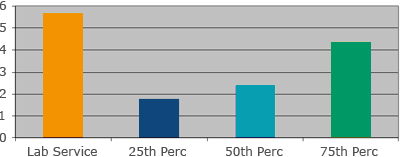
FIGURE 2: 2001 Benchmark Data
This chart shows the composition of tests processed in our laboratory for the full year in 2001. The tests were counted as reportable results, and the blue part shows the percentage of tests performed by our laboratory. Only 2.4% of our total test results were sent outside to other reference laboratories.
The following is a summary of recommended wellness tests at our institution:
Children: Newborn screen, spun hematocrit, urinalysis and urine culture
Adults: Cholesterol (or lipid panels), chlamydia, PAP smear, stool occult blood, prostatic specific antigen (with shared decision making between patient and provider)
Despite national recommendations, routine tests for blood counts, chemistry panels, thyroid stimulating hormone and urinalysis were frequently ordered during wellness visits. We felt this was a good area for improvement.
WHAT WE DID
We first started talking about our utilization and noticed that that test volumes began to fall. We revised our laboratory menu and test volumes fell by 10%. We then formed the laboratory utilization management committee (Lab UMC) and published the first provider report card in 2003.
THE REPORT CARD
For the report card to be effective, the Lab UMC felt the message needed to be focused, timely, relevant to the practice, set the expectations (targets) and unmasked so that providers can compare practice habits with one another.
In obtaining the data, it was clear that simple test counts by the laboratory were not sufficient and the test must relate to the diagnosis for which it was ordered. This meant that the source system had to be a data warehouse and not the LCS.
The data has to account for changes in the panel size and correct for practice intensity (I see more patients therefore I order more tests). Definitions for collecting the data must be precise (who really ordered the test, what exactly are the tests we are monitoring) and we had to pay close attention as to how the data was captured.
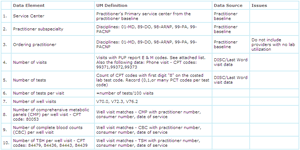
TABLE 1 is the template tool the committee developed with the information system specialist. We did pilot runs to check the data for accuracy and to examine the presentation. We dropped numbers that we felt were non-essential. The report was presented to selected leaders to obtain their opinion on what they felt was useful. We made additional changes after their input.
TABLE 1: Template tool used to obtain report card data from the data warehouse and the LCS
MEDICAL STAFF ACCEPTANCE
The report card lists practice characteristics for the nearly 250 physicians. We felt agreement on the part of medical leaders, content experts and practice committee was important to acceptance. Over a nine-month period, the Lab UMC Chairperson made 15 presentations to 13 different committees. In making our case, we pointed out that our utilization is higher than our peers, unnecessary tests were ordered on patients who are well and that this type of ordering drives utilization of more expensive services. After approval, we published the first report card in the first quarter of 2003, including an educational newsletter. TABLE 2 shows a copy of a report card. The report card is published quarterly with a newsletter summarizing our progress, remaining work, tips, and other news relating to lab utilization. We created a web site and posted all our reports, newsletters, articles and work plans for anyone who is interested. Physician names appear on the report cards to prompt discussion among peers on what works and what does not. The information is protected by the company's firewall, and is not used in performance assessment.
TABLE 2: Excerpt of an actual report card
The following is an excerpt of an actual report card. The data is genuine but the location, time and identity of providers are de-identified. The yellow bar lists the test level targets. The blue highlight shows where orders for the CBC and TSH exceeded the target.
| Laboratory Utilization Report Card; Quarter X, 2005; Clinic Y |
||||
| Tests per 100 well visits | ||||
| Physician | Well visits | CMP | CBC | TSH |
| Target | 0 | < 11 | < 7 | |
| Dr. A | 66 | 0 | 2 | 3 |
| Dr. B | 69 | 0 | 4 | 0 |
| Dr. C | 58 | 0 | 55 | 69 |
| Dr. D | 94 | 0 | 3 | 1 |
| Dr. E | 58 | 0 | 5 | 2 |
| Clinic Ave | 0 | 17 | 6 | |
| Organization Ave | 1 | 13 | 6 | |
| CMP = comprehensive metabolic panel; CBC = complete blood count; TSH= Thyroid stimulating hormone | ||||
TARGETS
There are no published benchmarks related to this type of utilization that the committee was aware of, so we chose to benchmark ourselves. We followed trends for one year before setting the targets.
We decided to set the CBC and TSH target to be half of the overall average, and to set the comprehensive metabolic panel at zero, since no one could think of any medical reason to order the 14-test panel on a well patient. We examined our practice trend after two years and readjusted the targets.
RESULTS
FIGURE 3 shows the practice trend in all three tests up to the third quarter of 2007. Each bar represents the quarterly average for the test. It shows a continuing decrease in the ordering of all three tests.
A rapid decrease in the beginning slowed in 2005. Further analysis of the data showed that 86% of physicians were ordering within target, but a handful (around 12) were ordering well above their peers.
Further investigation showed that these individuals were either new to the practice, worked as locum tenens or were veteran physicians who had been away and returned to practice. Reminder letters and informational articles were sent to the selected individuals and the downward utilization trend continued. The number of outlier physicians continues to decrease.
In the third quarter of 2007, we sent out only two letters to locum tenens. TABLE 3 shows a numeric summary of organizational averages. TABLE 4 shows the effect the letters had on the ordering patterns of eight physicians. Based on this information a yearly educational presentation to new physicians will begin this spring.
FIGURE 3: GHC Laboratory Utilization Management - Well Visit Testing Trends
This is a trend graph showing ordering levels for three targeted wellness tests over a four-year period. Each bar represents an organizational average of the test for that quarter. The first report cards were sent in first quarter of 2003. Since then, all targeted tests show a steady decline to where 2007 tests levels are a fraction of what they were at the beginning.
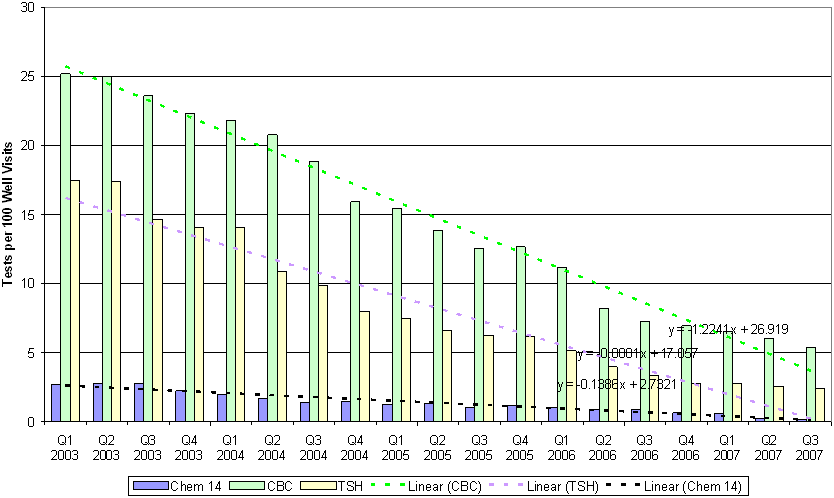
TABLE 3: Numeric summary of FIGURE 3
This table is a numeric summary of Figure 3. The numbers are the organizational averages of wellness testing (number of tests per 100 well visits) for the given quarter.
| Wellness Test |
2004 4th Qtr |
2005 4th Qtr |
2006 4th Qtr |
2007 3rd Qtr |
| CBC | 18.8 | 12.6 | 6.92 | 5.33 |
| TSH | 7.98 | 6.13 | 2.75 | 2.36 |
| CMP | 1.45 | 1.11 | 0.6 | 0.16 |
| CMP = comprehensive metabolic panel; CBC = complete blood count; TSH= Thyroid stimulating hormone | ||||
TABLE 4: Effect the reminder letters had on the CMP ordering levels of selected, de-identified providers
This table shows the effect the reminder letters had on the CMP ordering levels of selected, de-identified providers. The letters were sent out between the fourth quarter 2005 and first quarter of 2006.
| CMP per 100 well visits | |||
| Physician | Q4 05 | Q1 06 | Q2 06 |
| 1 | 13 | 2 | 0 |
| 2 | 30 | 0 | 0 |
| 3 | 12 | 17 | 0 |
| 4 | 11 | 14 | 1 |
| 5 | 12 | 14 | 2 |
| 6 | 11 | 12 | 0 |
| 7 | 24 | 20 | 4 |
| 8 | 31 | 24 | 7 |
DISCUSSION
Literature exists showing that physicians who receive feedback have the greatest reduction of laboratory test orders compared to control groups without feedback. In an outpatient system in the Netherlands [5], test ordering on patients seen for asthma, chronic obstructive pulmonary disease, degenerative joint disease and general complaints were followed for six-month period.
Physicians who received education and feedback ordered fewer tests. A two-year study in Ontario [6] showed that multifaceted education and feedback significantly decreased utilization, and the difference persisted after the intervention ended.
Other publications from the Netherlands show that routine individual feedback can have lasting results when maintained over long periods of time [7,8] lasting up to nine years [9].
Since starting our physician report card in 2003, we have maintained a decrease in the wellness tests for over four years. Physician feedback has been used in a hospital setting in the United States [10] but this is the first report that we are aware of where feedback has been maintained for a prolonged period of time in an ambulatory setting.
Physician feedback has been successfully applied to inpatient settings as well. In a tertiary hospital in Ottawa Canada, the hospital ban on chemistry panels were regularly reinforced with reminder letters on the patients’ charts, which resulted in a 38% decrease in test volume [11]. A surgical intensive care unit in Geneva, Switzerland, used physician feedback to encourage compliance with their hospital guideline on blood gas ordering [12].
We noticed from our database, especially for those physicians receiving reminder letters, that the report card has changed practice. Physicians might ask about the occasional patient who brings up a last minute complaint at the end of a wellness exam. They are counseled to order the test they need and code it for the complaint (e.g. "head ache, fatigue, pain") instead of a "well visit".
Periodic health exams consume a significant percentage of outpatient ambulatory care visits, averaging 8% nationally [12] or up to 35% in New England [13]. Before the report card, we observed that nearly 30% of outpatient tests were ordered as part of a well visit.
While it has long been known in the healthcare community that routine lab test panels are inefficient at detecting significant occult disease [14,15,16,17], it is not well known to the general public.
Many patients are unaware of national preventative health guidelines and expect an annual physical exam. They might not be confident that their doctor is doing an adequate job if the lab work is omitted [18]. Public education could help with this expectation.
For example, our organization offers patients the opportunity to complete an on-line "personalized health profile" as a self-educational tool [19].
Articles debunking the once popular "executive physical" and its associated tests are appearing in the popular press in response to growing concern with rising healthcare costs [20,21]. A book exploring the down side of cancer screening has been published for the general public [22].
Our study has several limitations. While we saved a modest amount of money in lab supplies, we have not shown that more expensive interventions (referrals to specialists, radiology, further testing) were prevented.
For this reason, we argue that ordering unnecessary tests is a quality rather than a cost issue. We did not perform any clinical outcomes measurements because we feel a well population has the lowest risk of a negative outcome. Moreover, our organization routinely monitors clinical outcomes in other wellness programs such as cardiovascular disease, diabetes, and certain cancers (breast, cervical, colon and prostate).
While we believe physicians are more deliberate in ordering tests now than in the past, we have not shown that decreasing wellness testing will decrease overall laboratory testing. In our experience, controlling overall utilization requires different strategies that depend on the test and its clinical utility.
CONCLUSION
Regular physician feedback is effective in reducing unnecessary tests and can maintain progress over a long period of time. It raises general awareness when physicians order tests, at a time when it is easily overlooked in a busy practice.
The database built up over the years has been useful in targeting specific areas for improvement. To achieve universal acceptance the report needs to be timely, consistent, objective and unmasked while allowing the data to "speak for itself".
References+ View more
- Chacko KM, Feinberg LE. Laboratory screening at preventive health exams; trend of testing, 1978-2004. Am J Prev Med. 2007; 32(1): 59-62.
- Thompson RS, et al. Changes in physician behavior and cost savings associated with organizational recommendation on the use of "routine" chest X-rays and multichannel blood tests. Preventative Medicine. 1983; 12: 385-396.
- American Academy of Family Practice [homepage on the Internet]. Summary of policy recommendations for clinical preventative services. Revision 6.4. August 2007 [cited Feb 14]. Available from: www.aafp.org/online/en/home/clinical/exam.html
- Guide to Clinical Preventive Services, 2007. AHRQ Publication No. 07-05100, September 2007 [cited Feb 14]. Agency for Healthcare Research and Quality, Rockville, MD. Available from: www.ahrq.gov/clinic/pocketgd.htm
- Verstappen, WHJM. Effect of a practice-based strategy on test ordering performance of primary care physicians, a randomized trial. JAMA 2003; 289(18): 2407-12.
- Bunting PS, Van Walraven C. Effect of a controlled feedback intervention on laboratory test ordering by community physicians. Clinical Chemistry. 2004; 50:2, 321-326.
- Winkens RAG, Pop P, Grol RPTM, Bugter-Maessen AMA, Kester ADM, Beusmans GHMI, Knottnerus JA. Randomised controlled trial of routine individual feedback to improve rationality and reduce numbers of test requests. Lancet. 1995; 345: 498-502.
- Winkens RAG, Pop P, Grol RPTM, Kester ADM, Knottnerus JA. Effect of feedback on test ordering behaviour of general practitioners. BMJ. 1992; 304: 1093-1096.
- Winkens RAG, Pop P, Grol RPTM, Bugter-Maessen AMA, Kester ADM, Beusmans GHMI, Knottnerus JA. Effects of routine individual feedback over nine years on general practitioners' requests for tests. BMJ. 1996; 312: 490.
- Studnicki J, Bradham DD, Marshburn J, Foulis PR, Staumfjord JV. A feedback system for reducing excessive laboratory tests. Arch Pathol Lab Med. 1993; 117: 35-39.
- Lyon AW, Greenway DC, Hindmarsh JR. A strategy to promote rational clinical chemistry test utilization. Clinical Chemistry. 1995; 103: 718-724.
- Merlani P, Garmerin P, Diby M, Rerring M, Ricou B. Quality improvement report: linking guideline to regular feedback to increase appropriate requests for clinical tests; blood gas analysis in intensive care. BMJ. 2001; 323: 620-624. Corrections/clarifications. BMJ. 2001; 323: 993.
- Mehrotra A, Zaslavsky AM, Ayanian JZ. Preventative Health Examinations and Preventive Gynecological Examinations in the United States. Arch Intern Med. 2007; 167(17): 1876-83.
- Luckmann R, Melville SK. Periodic health evaluation of adults; a survey of family physicians. J. Fam Pract. 1995; 40: 547-54.
- Boland BJ, Wollan PC, Silverstein MD. Yield of laboratory tests for case-finding in the ambulatory general medical examination. Am J Med. 1996; 101:142-152.
- Tabas GH, Vanek MS. Is 'routine' laboratory testing a thing of the past? Postgraduate Medicine. 1999; 105(3): 213-220.
- Chacko KM, Anderson RJ. The annual physical examination: important or time to abandon? Am J of Medicine. 2007; 120: 581-83.
- Oboler SK, et al. Public expectations and attitudes for the annual physical examinations and testing. Ann Intern Med. 2002; 136: 652-659.
- Group Health Cooperative [homepage on the Internet - cited Feb 14]. Available from: www.ghc.org
- Solovitch S. Let's get less physical; the yearly checkup is reassuring—but unnecessary. To make it matter, doctors and patients must talk. LA Times. 2006 Feb 13.
- Panel: Many regular medical tests unnecessary. USA Today. 2002 Feb 19.
- Welch HG. Should I be tested for cancer? Maybe not and here's why. University of California Press; 2004.
References
- Chacko KM, Feinberg LE. Laboratory screening at preventive health exams; trend of testing, 1978-2004. Am J Prev Med. 2007; 32(1): 59-62.
- Thompson RS, et al. Changes in physician behavior and cost savings associated with organizational recommendation on the use of "routine" chest X-rays and multichannel blood tests. Preventative Medicine. 1983; 12: 385-396.
- American Academy of Family Practice [homepage on the Internet]. Summary of policy recommendations for clinical preventative services. Revision 6.4. August 2007 [cited Feb 14]. Available from: www.aafp.org/online/en/home/clinical/exam.html
- Guide to Clinical Preventive Services, 2007. AHRQ Publication No. 07-05100, September 2007 [cited Feb 14]. Agency for Healthcare Research and Quality, Rockville, MD. Available from: www.ahrq.gov/clinic/pocketgd.htm
- Verstappen, WHJM. Effect of a practice-based strategy on test ordering performance of primary care physicians, a randomized trial. JAMA 2003; 289(18): 2407-12.
- Bunting PS, Van Walraven C. Effect of a controlled feedback intervention on laboratory test ordering by community physicians. Clinical Chemistry. 2004; 50:2, 321-326.
- Winkens RAG, Pop P, Grol RPTM, Bugter-Maessen AMA, Kester ADM, Beusmans GHMI, Knottnerus JA. Randomised controlled trial of routine individual feedback to improve rationality and reduce numbers of test requests. Lancet. 1995; 345: 498-502.
- Winkens RAG, Pop P, Grol RPTM, Kester ADM, Knottnerus JA. Effect of feedback on test ordering behaviour of general practitioners. BMJ. 1992; 304: 1093-1096.
- Winkens RAG, Pop P, Grol RPTM, Bugter-Maessen AMA, Kester ADM, Beusmans GHMI, Knottnerus JA. Effects of routine individual feedback over nine years on general practitioners' requests for tests. BMJ. 1996; 312: 490.
- Studnicki J, Bradham DD, Marshburn J, Foulis PR, Staumfjord JV. A feedback system for reducing excessive laboratory tests. Arch Pathol Lab Med. 1993; 117: 35-39.
- Lyon AW, Greenway DC, Hindmarsh JR. A strategy to promote rational clinical chemistry test utilization. Clinical Chemistry. 1995; 103: 718-724.
- Merlani P, Garmerin P, Diby M, Rerring M, Ricou B. Quality improvement report: linking guideline to regular feedback to increase appropriate requests for clinical tests; blood gas analysis in intensive care. BMJ. 2001; 323: 620-624. Corrections/clarifications. BMJ. 2001; 323: 993.
- Mehrotra A, Zaslavsky AM, Ayanian JZ. Preventative Health Examinations and Preventive Gynecological Examinations in the United States. Arch Intern Med. 2007; 167(17): 1876-83.
- Luckmann R, Melville SK. Periodic health evaluation of adults; a survey of family physicians. J. Fam Pract. 1995; 40: 547-54.
- Boland BJ, Wollan PC, Silverstein MD. Yield of laboratory tests for case-finding in the ambulatory general medical examination. Am J Med. 1996; 101:142-152.
- Tabas GH, Vanek MS. Is 'routine' laboratory testing a thing of the past? Postgraduate Medicine. 1999; 105(3): 213-220.
- Chacko KM, Anderson RJ. The annual physical examination: important or time to abandon? Am J of Medicine. 2007; 120: 581-83.
- Oboler SK, et al. Public expectations and attitudes for the annual physical examinations and testing. Ann Intern Med. 2002; 136: 652-659.
- Group Health Cooperative [homepage on the Internet - cited Feb 14]. Available from: www.ghc.org
- Solovitch S. Let's get less physical; the yearly checkup is reassuring—but unnecessary. To make it matter, doctors and patients must talk. LA Times. 2006 Feb 13.
- Panel: Many regular medical tests unnecessary. USA Today. 2002 Feb 19.
- Welch HG. Should I be tested for cancer? Maybe not and here's why. University of California Press; 2004.
May contain information that is not supported by performance and intended use claims of Radiometer's products. See also Legal info.
Acute care testing handbook
Get the acute care testing handbook
Your practical guide to critical parameters in acute care testing.
Download nowScientific webinars
Check out the list of webinars
Radiometer and acutecaretesting.org present free educational webinars on topics surrounding acute care testing presented by international experts.
Go to webinars


