Printed from acutecaretesting.org
October 2002
Understanding the different values in electrolyte measurements
THE BLOOD SAMPLE
In order to discuss the two technologies primarily used for the measurement of electrolytes it is necessary to clarify which part of the blood is used for the measurement.
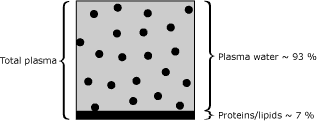
A whole-blood sample consists of total plasma and the erythrocytes. Total plasma consists of a water phase and a number of solid components consisting of proteins and lipids. Usually, the solids in plasma make up approx. 7 % of the total plasma volume. Water accounts for 93 %. See Fig.1.
 |
FIG. 1 |
The electrolytes are present in the plasma water only, and that is what the body is responding to. Thereby it is actually only the plasma water that is of interest for the measurement of electrolytes.
One measuring technology responds to the electrolyte content in the plasma water (direct ISE) and the other (indirect ISE) responds to the electrolyte content in the volume of total plasma. Thereby the distribution between water and solid phase is of importance, as the protein and lipid content may vary from the normal and will cause a difference in the reported results from the two different measuring technologies.
The technology used for the measurement of electrolytes responds to the electrolyte content in the plasma water and reflects the physiological situation, thereby giving the most useful result for the physician to act upon. This technology as called direct ISE.
MEASURING TECHNOLOGIES
The two different technologies used for the measurement of electrolytes are named in various ways in the literature; however, the most frequently used names are direct ISE and indirect ISE. ISE means ion-selective electrodes.Indirect ISE:
- Measures on a total plasma sample (or serum) that has been diluted with a large volume of diluent.
- Requires that the plasma and erythrocytes are separated by centrifugation.
- Due to the dilution, this method measures the mean concentration in plasma, i.e. the weighted average between the concentration in the electrolyte-containing water part and in the electrolyte-free protein/lipid part. The concentration is calculated by multiplying the result with the dilution factor.
- The results are comparable to flame photometry.
- This technology is typically used in the large so-called chemistry analyzers in the centralized laboratory.
- The reported result depends of the content of solids in the sample.
Direct ISE:
-
Measures on a non-diluted whole-blood or plasma sample. However, the actual measurement is performed on the plasma water.
-
When whole blood is used, it does not involve any sample preparation.
-
Direct ISE actually measures the electrolyte activity in the plasma water (mmol/kg H2O) rather than "concentration in the plasma (mmol/L)". The electrochemical activity of the ions in the water is converted to the readout concentration by a fixed (ion-specific) multiplier. This is only accurate for a given ionic strength, usually chosen to equal 160 mmol/L for plasma.
The use of this fixed factor ensures that direct ISE reflects the actual, clinically relevant activity, irrespective of the level of proteins and/or lipids [2]. This is not changed by the fact that the result traditionally is termed "concentration".
This conversion is based on recommendations from the IFCC Expert Panel on pH and Blood Gases and is made in order to avoid the confusion of having two types of electrolytes results. -
This technology is typically used in blood gas analyzers and POC electrolyte analyzers, and these may be placed both in the laboratory and in a point-of-care environment.
-
The reported result is independent of the content of solids in the sample.
In conclusion, the results from the two different types of analyzer are brought to correlate for samples with a normal content of proteins and lipids. This, of course, requires that all preanalytical and analytical variations are eliminated.
SAMPLES WITH AN ABNORMAL PROTEIN/LIPID CONTENT
The variation of the content of proteins and lipids from the normal situation will cause an error on the reported electrolyte results from the indirect ISE.
In the literature, it is reported that the error is less than 5 % when triglyceride concentration is less than 2500 mg/dL (recommended level is 35-160 mg/dL) [3]. The impact of errors on the measurement of electrolytes applies to all electrolytes; however, it is most pronounced on sodium.
Examples of errors on sodium from the literature: An error of 17 mmol/L [4] is reported with an increased protein content, and an error of 26 mmol/L [4] due to increased lipid content.
When the solid content deviates from the normal, it is typically increased, and the typical types of error are then:
- Electrolyte concentration is reported as normal or low when it is actually dangerously high, or
- Electrolyte concentration is reported as too low when it is actually normal.
The latter phenomenon is also called pseudohyponatremia where sodium is concerned.
Increased content of protein and lipids is the case for a long list of common medical conditions such as diabetes, liver and kidney syndromes, alcoholism, etc. Due to its magnitude is may lead the physicians to life-threatening erroneous conclusions and should therefore be taken into consideration when evaluating electrolyte results reported from the indirect ISE technology.
Appendix A gives a more in-depth explanation with an actual example of the difference between the reported results from direct and indirect ISE technology. Appendix B gives a method on how to calculate the difference for a given volume of solids.
APPENDIX A - AN EXAMPLE
As previously mentioned, indirect ISE measures the mean concentration of electrolytes in plasma, i.e. the weighted average between the concentration of the electrolyte-containing water and the electrolyte-free protein/lipid. As a consequence of this, the reported value will depend on the protein/lipid level. This is not the case with direct ISE that measures the electrolyte activity in the water part of the plasma.
In Table I, this is illustrated by an example.
Three samples are compared:
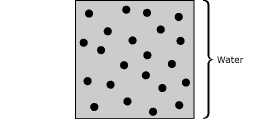
- Sample A (typical calibration solution) consists only of water, Fig. 2.
 |
FIG. 2 |
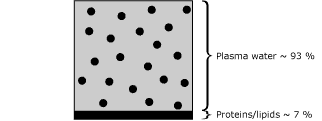
- Sample B (normal adult plasma sample) consists of 93 % water and 7 % lipid/protein, Fig. 3.
 |
FIG. 3 |
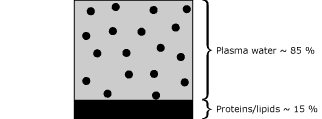
- Sample C (plasma with increased lipid level) has a protein/lipid volume equal to 15 %. Fig. 4.
 |
FIG. 4 |
Only the water contains electrolytes, and all water has the same concentration of electrolytes irrespective of whether the water is part of sample A, B or C; i.e. the three samples all have the same level physiologically.
The table lists the volumes and concentrations as they apply to a sample size of 100 µL. The concentration of sodium in the water has been set at 150 mmol/L = 150 nmol/µL water.
The direct-ISE electrodes calibrated on aqueous solutions (and without any special corrections) report the concentration of the ions in the water part. In this case, they report 150 nmol/µL water for all three samples, reflecting the fact that the sodium concentrations (activities) in the three water parts are equal.
Dilution involves taking a certain volume of the total sample, not only of the water, adding to this a diluent before the resulting mixture is measured. The total number of sodium ions/atoms in the sample is then expressed as the average concentration in the total volume of the original sample.
As a consequence of this, the reported values depend on the protein/lipid level of the samples.
|
Sample description and composition |
A
|
B
|
C
|
|
Total sample volume (µL) |
100 |
100 |
100 |
|
Lipid/protein volume (µL) |
0 |
7 |
15 |
|
Water volume (µL) |
100 |
93 |
85 |
|
cNa+ in water (nmol/µL)
|
150 |
150 |
150 |
|
Total amount of Na (nmol) in sample |
15000 |
13950 |
12750 |
|
Average cNa+ in sample
(nmol/µL)
|
150.0 |
139.5 |
127.5 |
TABLE I
Comparison between the direct ISE results and the dilution-method results shows that the difference increases with increasing volume of non-electrolyte-containing protein/lipid. This also illustrates that it is not possible to correct the results to agree with each other, unless the relative volume of the water is determined for each sample.
APPENDIX B - HOW TO CALCULATE THE DIFFERENCE FOR A GIVEN VOLUME OF SOLIDS
According to the outline above, the main factor determining the magnitude of the difference is the relative volume of the protein/lipid in plasma. A simplified calculation is shown on Table II.
|
Sample description and composition |
Plasma with
|
Plasma
|
|
|
Total sample volume (µL) |
100 |
100 |
|
|
Lipid/protein volume (µL) |
7 |
x |
|
|
Water volume (µL) |
93 |
100-x |
|
|
cNa+ in water (nmol/µL) |
150 |
150 |
|
|
Total amount of Na+ (nmol) |
13950 |
150 × (100 – x) |
|
|
Average cNa+ in sample (nmol/µL) |
139.5 |
150 × (100 – x) / 100
|
|
|
Direct ISE value |
Internal value |
150 |
150 |
|
|
Readout
|
139.5 |
139.5 |
|
Dilution method, readout |
139.5 |
150 – 1.5 × x |
|
|
Difference (direct ISE - indirect ISE) |
0 |
–10.5 + 1.5 × x
|
|
TABLE II
ExampleQ: What is the expected difference between the sodium results from an analyzer using indirect ISE and an analyzer using direct ISE for a given sodium concentration of 140 mmol/L plasma, if the plasma protein is a) 70 g/L (normal), b) 40 g/L (often seen in ICU patients) or c) 0 g/dL (seen in QC solutions or proficiency test samples)?
A: Plasma protein levels of 70, 40 or 0 g/L correspond to
approx. 7, 4, or 0 vol%, respectively. Assuming that no lipids are
present, the expected differences for cNa+ (direct ISE – indirect
ISE) would be
a) cNa+ = –10.5 + 1.5 ×
7 = 0
b) cNa+ = –10.5 + 1.5 ×
4 = –4.5 (mmol/L).
c) cNa+ = –10.5 + 1.5 ×
0 = –10.5 mmol/L. For QC solutions, the analyzer using indirect ISE
will report values that are 7 % higher than the analyzer using
direct ISE.
References+ View more
- Ladenson JH et al. Sodium measurements in multiple myeloma: Two techniques compared. Clin Chem 1982; 28: 2383-86.
- Maas AHJ, Siggaard-Andersen O, Weisberg HF, Zijlstra WG. Ion-selective electrodes for sodium and potassium: A new problem of what is measured and what should be reported. The Newsletter of the International Federation of Clinical Chemistry 1982; 31,2: 5.
- Tietz NW, Pruden EL, Siggaard-Andersen O. In Tietz NW, Fundamentals of Clinical Chemistry. 4th edition. Philadelphia: W.B. Saunders Company, 1996: 497-505.
- NCCLS Publication C29-A2 Standardization of sodium and potassium Ion-Selective Electrode Systems to Flame Photometric Reference Method; Approved Standard - Second Edition. NCCLS, 2000; 17, 18.
References
- Ladenson JH et al. Sodium measurements in multiple myeloma: Two techniques compared. Clin Chem 1982; 28: 2383-86.
- Maas AHJ, Siggaard-Andersen O, Weisberg HF, Zijlstra WG. Ion-selective electrodes for sodium and potassium: A new problem of what is measured and what should be reported. The Newsletter of the International Federation of Clinical Chemistry 1982; 31,2: 5.
- Tietz NW, Pruden EL, Siggaard-Andersen O. In Tietz NW, Fundamentals of Clinical Chemistry. 4th edition. Philadelphia: W.B. Saunders Company, 1996: 497-505.
- NCCLS Publication C29-A2 Standardization of sodium and potassium Ion-Selective Electrode Systems to Flame Photometric Reference Method; Approved Standard - Second Edition. NCCLS, 2000; 17, 18.
Acute care testing handbook
Get the acute care testing handbook
Your practical guide to critical parameters in acute care testing.
Download nowScientific webinars
Check out the list of webinars
Radiometer and acutecaretesting.org present free educational webinars on topics surrounding acute care testing presented by international experts.
Go to webinars


