Printed from acutecaretesting.org
August 2016
Urea and the clinical value of measuring blood urea concentration


SummaryThis first of two articles on understanding the clinical value of measuring urea concentration dives into the physiological topics, such as urea production and renal processing of urea as well as the causes of increased and reduced urea concentration.
Kidney disease is associated with reduced urea excretion and consequent rise in blood concentration. The advantages and limitations of measuring urea for the assessment of renal function will be explored in depth in this article and compared to creatinine in the upcoming follow-up article.
Urea – a brief historical perspective
Urea owns special historical significance compared with most other analytes currently measured in the clinical laboratory or at the point of care.
The application of chemistry to medicine, from which emerged the discipline of chemical pathology (clinical chemistry) in the mid-19th century, has its origins in the early 18th century, when urine, the most readily available of body fluids, was first subjected to chemical analysis.
As the most abundant nonaqueous constituent of urine, urea featured from the beginning of this long story. Discovery of urea is credited to the Dutch physician Hermann Boerhaave who first isolated it, in impure form, from urine around 1727 [1].
The first pure preparation of urea from urine was made in 1817 by the English physician/ chemist William Prout [2]. Urea was the first organic chemical to be synthesized from inorganic chemicals.
This synthesis, which was serendipitously achieved by Friedrich Wöhler in 1828, has particular significance because it marked the birth of organic chemistry and raised the first doubts about the then long-held popular belief that an undefined “vital force” was required to synthesize chemicals involved in the process of living organisms [3].
The presence of urea in blood and confirmation of its identity with that found in urine was demonstrated in 1822 [1] but reliable methodology for determination of the concentration of urea in blood had to wait until the early years of the 20th century [4].
In the meantime, it was clear by the mid-19th century that kidney disease was associated with reduced urinary excretion of urea, and estimation of urea in urine for clinical purposes was established by this time [5],[6].
Improved methods of blood urea estimation in the early decades of the 20th century allowed plasma/serum urea concentration to emerge as the most widely used routine test of renal function, a pre-eminence that continued for close to 60 years.
In recent times, plasma creatinine estimation has emerged as the preferred first-line test for laboratory assessment of renal function [7],[8] but measurement of plasma/serum urea concentration continues to have clinical value in the 21st century – albeit much less so than was once the case.
Background physiology - urea production and excretion
Urea is a small organic molecule (MW 60) comprising two amino (NH2) groups and a linked carbamyl (C-O) group:
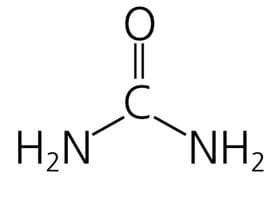
It is the principal nitrogenous end product of protein and amino acid catabolism. Proteins are first degraded to constituent amino acids, which are in turn degraded (deaminated), with production of ammonia (NH3), which is toxic.
In a series of five enzymatically controlled reactions, known collectively as the “urea cycle”, toxic ammonia resulting from protein breakdown is converted to non-toxic urea.
In addition to ammonia and the five ”urea cycle” enzymes, endogenous production of urea requires the presence of bicarbonate, aspartate and energy input in the form of adenosine triphosphate (ATP).
Carbon dioxide (CO2) is a secondary product of the urea cycle. Almost all of this urea production occurs in the cells of the liver (hepatocytes); the only other source is the cells of the kidneys.
As might be expected, the rate of urea production is influenced by protein content of diet; low-protein diet is associated with reduced urea production and high-protein diet is associated with increased urea production.
Starvation is, perhaps counterintuitively, associated with increased urea production but this is explained by the increased protein released from muscle tissue breakdown (autolysis) that occurs during starvation to provide an energy source.
Any pathology associated with tissue breakdown is for the same reason associated with increased urea production. Detail of the urea cycle and its regulation is the subject of a recent review [9].
A small amount (<10 %) of urea is eliminated via sweat and the gut, but most of the urea produced in the liver is transported in blood to the kidneys where it is eliminated from the body in urine.
This process of renal elimination, which is detailed in a recent review [10], begins with filtration of blood at the glomeruli of the approximately 1 million nephrons contained within each kidney.
During glomerular filtration, urea passes from blood to the glomerular filtrate, the fluid that is the precursor of urine. The concentration of urea in the filtrate as it is formed is similar to that in plasma so the amount of urea entering the proximal tube of the nephron from the glomerulus is determined by the glomerular filtration rate (GFR).
Urea is both reabsorbed and secreted (recycled back into the filtrate) during passage of the filtrate through the rest of the tubule of the nephron; the net effect of these two processes results in around 30-50 % of the filtered urea appearing in urine.
The facility of the kidney to adjust urea reabsorption and secretion as the filtrate passes through the tubule determines an important role for urea in the production of a maximally concentrated urine, when this becomes necessary.
The mechanism of this water-conserving action of urea within the nephron is well detailed by Weiner et al [10].
Although often considered simply a metabolic waste product, urea has two important physiological functions outlined above: detoxification of ammonia and water conservation.
Measurement of plasma/serum urea – a note on nomenclature and units
Around the world, essentially the same method of urea analyses is used, but the result is expressed in two quite different ways [11]. In the US and a few other countries, plasma or serum urea concentration is expressed as the amount of urea nitrogen.
Although plasma or serum is used for the analysis, the test is still, somewhat confusingly, commonly referred to as blood urea nitrogen (BUN), and the unit of BUN concentration is mg/dL.
In all other parts of the world, urea is expressed as the whole molecule (not just the nitrogen part of the molecule) in SI units (mmol/L). Since BUN reflects only the nitrogen content of urea (MW 28) and urea measurement reflects the whole of the molecule (MW 60), urea is approximately twice (60/28 = 2.14) that of BUN.
Thus BUN 10 mg/dL is equivalent to urea 21.4 mg/dL.
To convert BUN (mg/dL) to urea (mmol/L):
multiply by 10 to convert from /dL to /L and divide by 28 to convert from mg BUN to mmol urea, i.e. 10/28 = 0.357
So the conversion factor is 0.357
BUN mg/dL multiplied by 0.357 = urea (mmol/L)
Urea (mmol/L) divided by 0.357 = BUN (mg/dL)
Approximate reference (normal) range:
Serum/plasma urea 2.5-7.8 mmol/L
Serum/plasma BUN 7.0-22 mg/dL
[It is widely accepted that there is an age-related increase in plasma/serum urea concentration [11],[12] but this is not well defined and there is uncertainty as to whether it simply reflects an age-related decline in renal function as some studies [13] suggest, or occurs despite normal renal function as others [14] seem to suggest. The results of [14] suggest that healthy elderly individuals (without any apparent loss of renal function), may have BUN levels as high as 40-50 mg/dL
(14.3-17.8 mmol/L)].
Causes of increased serum/plasma urea
Serum/plasma urea concentration reflects the balance between urea production in the liver and urea elimination by the kidneys, in urine; so increased plasma/serum urea can be caused by increased urea production, decreased urea elimination, or a combination of the two.
By far the highest levels occur in the context of reduced urinary elimination of urea due to advanced renal disease and associated marked reduction in glomerular filtration rate (GFR).
GFR is a parameter of prime clinical significance because it defines kidney function. All those with reduced kidney function, whatever its cause have reduced GFR and there is good correlation between GFR and severity of kidney disease.
The rate of decline in GFR distinguishes chronic kidney disease (CKD) and acute kidney injury (AKI). CKD is associated with irreversible slow decline in GFR over a period of many months, years or even decades; whereas AKI is associated with precipitous decline in GFR over a period of hours or days; AKI is potentially reversible.
The value of urea as a test of renal function depends on the observation that serum/plasma urea concentration reflects GFR: as GFR declines, plasma/serum urea rises.
The limitation of urea as a test of renal function is that in some circumstances plasma urea is not a sufficiently accurate reflection of GFR. For example, urea is an insensitive indicator of reduced GFR; GFR must be reduced by around 50 % before serum/plasma urea increases above the upper limit of the reference range [15].
Furthermore, urea may be raised despite a normal GFR (i.e. normal renal function) so as a test of renal function, urea lacks specificity [7],[8],[15].
Non-renal causes of increased plasma/serum urea
The causes of increased plasma/serum urea in association with normal GFR, i.e. normal renal function, include the physiological and the pathological. The two physiological causes are increased dietary protein and ageing.
As previously mentioned, increase in dietary protein results in increased urea production. If sufficiently marked, this increased urea production can cause plasma/serum urea to rise. Mention has also been made of the age-related increase in plasma/ serum urea.
Gastrointestinal hemorrhage is associated with increased protein intake (blood in the gut is effectively a high-protein meal) and thereby increased urea production and consequent increased plasma/serum urea [16].
Increased protein catabolism and consequent increased urea synthesis accounts, at least in part, for the increased plasma/serum urea that accompanies conditions that are associated with tissue damage, e.g. trauma, major surgery, starvation, severe infection.
The role of urea in the maximal conservation of water by the kidney involves increased urea reabsorption and consequent tendency to mild increase in plasma/serum urea.
Low circulatory states such as heart failure [17], dehydration [18], hypovolemic shock, necessarily invoke aspects of this adaptive response and all may be associated with mild increase in plasma/serum urea, despite normal GFR.
Drugs that induce a catabolic state with increased protein breakdown and consequent increased urea production can cause plasma/serum urea to rise slightly; the most widely cited drug group to have this effect is the corticosteroids.
Causes of reduced plasma/serum urea
Reduced plasma/serum urea is less common [19] and usually of less clinical significance than increased plasma/serum urea.
Since urea concentration in plasma or serum reflects the balance between urea production and urea elimination in urine, reduced plasma/serum urea can be caused by decreased urea production, increased urinary urea excretion, or a combination of the two.
There are two physiological causes of reduced concentration: low-protein diet, and pregnancy.
Low-protein diet is associated with reduced urea production and consequent tendency to reduced plasma/serum urea concentration.
The reduced plasma/serum urea that commonly occurs during pregnancy is due to the combined effect of reduced urea production and increased urea excretion [20]. The increased urea excretion is consequent on increased GFR, a welldocumented physiological adaptation to pregnancy.
Pathological cause of reduced urea concentration is largely confined to advanced liver disease [20].
This reflects the central role that the liver plays in urea production via the urea cycle. Inherited deficiency of any one of the five enzymes of the urea cycle describes a rare group of conditions (called the urea cycle defects) that can give rise to reduced urea synthesis and consequent reduced plasma/serum urea concentration.
A recently published case history [21] exemplifies this very rare cause of decreased plasma/serum urea. Overhydration induces increased GFR and consequent increased excretion of urea. For this reason overhydration, as might occur, for example, in the syndrome of inappropriate antidiuretic hormone (SIADH), is often associated with decreased plasma/serum urea.
The causes of increased and decreased plasma/serum urea are listed in boxes below:
|
Causes of increased plasma/serum urea concentration
|
In general, the non-renal causes of increased plasma/serum urea result in a mild to moderate increase (usually no greater than 10.0 mmol/L (BUN 28 mg/dL). Concentration in patients with renal dysfunction can range from mildly increased to severely increased, depending on severity of disease.
Those with end-stage renal failure, requiring renal replacement therapy (dialysis, renal transplantation) may have plasma/serum urea >50.0 mmol/L (BUN >140 mg/dL).
The higher the concentration above 10 mmol/L, the greater is the chance that it is due to renal disease, but a slight increase cannot, of itself, be assumed to be due to a non-renal cause.
|
Causes of decreased plasma/serum urea concentration
|
Summary
Urea is a waste product of metabolism that is excreted by the kidneys in urine. Kidney disease is associated with reduced urea excretion and consequent rise in blood concentration.
Once the primary laboratory test for detection and monitoring of reduced renal function (kidney disease), that role is now fulfilled by the plasma/serum creatinine test.
The limitation of urea as a test of renal function relates to reduced sensitivity and specificity so that a normal urea does not necessarily exclude renal disease and a slight to moderate increase in urea cannot be assumed to be due to renal disease.
There are many non-renal causes that can be associated with such a rise and for some of these conditions, e.g. heart failure, dehydration is common. By comparison with urea, creatinine measurement is no more sensitive but is more specific.
Under some circumstances urea may be more sensitive for detection of early renal disease than creatinine, so it has some advantage.
These issues will be explored further in a second article that will focus on the clinical value of measuring urea and creatinine together and calculating the urea: creatinine ratio.
References+ View more
- Kurzer F et tal. Urea in the history of organic chemistry: Isolation from natural sources. J Chem Educ 1956; 33, 9: 452-59.
- Rosenfeld L. William Prout: Early 19th century physician-chemist. Clinical chemistry 2003; 49, 4: 699-705.
- Cohen PS et tal. Wöhler’s synthesis of urea: How do the textbooks report it? J Chem Educ 1996; 73, 9: 883-86.
- van Slyke DD. A permanent preparation of urease, and its use for rapid and accurate determination of urea. JAMA 1914; LXII, 20: 1558-59.
- Thudichum JLW. On the analysis of urea in urine for clinical purposes. BMJ 1857; s4-1, 38: 788-90.
- Green WE. The practical utility of estimating the amount of urea passed daily. BMJ 1885; 2, 1301: 1055-57.
- Traynor J et tal. How to measure renal function in clinical practice. BMJ (Clinical research ed.) 2006; 333, 7571: 733-37.
- McWilliam A et tal. Laboratory tests of renal function. Anaesthesia & Intensive Care Medicine 2009; 10, 6: 296-99.
- Watford M. The urea cycle: Teaching intermediary metabolism in a physiological setting. Biochem Mol Biol Educ 2003; 31, 5: 289-97.
- Weiner ID et tal. Urea and ammonia metabolism and the control of renal nitrogen excretion. CJASN 2015; 10, 8: 1444-58.
- Lamb E et tal. Kidney Function Tests (Chapter 25) In: Tietz Textbook of Clinical Chemistry and Molecular Diagnostics. By: Burtis CA, Ashwood ER, Bruns DE. Elsevier Health Sciences; 2012. Available from: URL:https://books.google.dk/books?id=BBLRUI4aHhkC.
- Bowker LK et tal. Raised blood urea in the elderly: a clinical and pathological study. Postgrad Med J 1992; 68, 797: 174-79.
- Chung J et tal. P15 Elevated urea in the elderly: Age or EGFR – a database analysis. [cited 2015 Nov 26]. Available from:www.aacb.asn.au/documents/item/960.
- Musch W et tal. Age-related increase in plasma urea level and decrease in fractional urea excretion: clinical application in the syndrome of inappropriate secretion of antidiuretic hormone. CJASN 2006; 1, 5: 909-14.
- Baum N et tal. Blood urea nitrogen and serum creatinine. Urology 1975; 5, 5: 583-88.
- Witting MD et tal. ED predictors of upper gastrointestinal tract bleeding in patients without hematemesis. Am J Emerg Med 2006; 24, 3: 280-85.
- Aronson D et tal. Elevated blood urea nitrogen level as a predictor of mortality in patients admitted for decompensated heart failure. The Am J Med 2004; 116, 7: 466-73.
- Mehta AR. Why does the plasma urea concentration increase in acute dehydration? Advances in physiology education 2008; 32, 4: 336.
- Lum G et tal. Significance of low serum urea nitrogen concentrations. Clin Chem 1989; 35, 4: 639-40.
- Kalhan SC. Protein metabolism in pregnancy. Am J Clin Nutr 2000; 71, 5 Suppl: 1249S-55S.
- Salek J et tal. Recurrent liver failure in a 25-year-old female. Liver transplantation: official publication of the American Association for the Study of Liver
Diseases and the International Liver Transplantation Society 2010; 16, 9: 1049-53.
References
- Kurzer F et tal. Urea in the history of organic chemistry: Isolation from natural sources. J Chem Educ 1956; 33, 9: 452-59.
- Rosenfeld L. William Prout: Early 19th century physician-chemist. Clinical chemistry 2003; 49, 4: 699-705.
- Cohen PS et tal. Wöhler’s synthesis of urea: How do the textbooks report it? J Chem Educ 1996; 73, 9: 883-86.
- van Slyke DD. A permanent preparation of urease, and its use for rapid and accurate determination of urea. JAMA 1914; LXII, 20: 1558-59.
- Thudichum JLW. On the analysis of urea in urine for clinical purposes. BMJ 1857; s4-1, 38: 788-90.
- Green WE. The practical utility of estimating the amount of urea passed daily. BMJ 1885; 2, 1301: 1055-57.
- Traynor J et tal. How to measure renal function in clinical practice. BMJ (Clinical research ed.) 2006; 333, 7571: 733-37.
- McWilliam A et tal. Laboratory tests of renal function. Anaesthesia & Intensive Care Medicine 2009; 10, 6: 296-99.
- Watford M. The urea cycle: Teaching intermediary metabolism in a physiological setting. Biochem Mol Biol Educ 2003; 31, 5: 289-97.
- Weiner ID et tal. Urea and ammonia metabolism and the control of renal nitrogen excretion. CJASN 2015; 10, 8: 1444-58.
- Lamb E et tal. Kidney Function Tests (Chapter 25) In: Tietz Textbook of Clinical Chemistry and Molecular Diagnostics. By: Burtis CA, Ashwood ER, Bruns DE. Elsevier Health Sciences; 2012. Available from: URL:https://books.google.dk/books?id=BBLRUI4aHhkC.
- Bowker LK et tal. Raised blood urea in the elderly: a clinical and pathological study. Postgrad Med J 1992; 68, 797: 174-79.
- Chung J et tal. P15 Elevated urea in the elderly: Age or EGFR – a database analysis. [cited 2015 Nov 26]. Available from:www.aacb.asn.au/documents/item/960.
- Musch W et tal. Age-related increase in plasma urea level and decrease in fractional urea excretion: clinical application in the syndrome of inappropriate secretion of antidiuretic hormone. CJASN 2006; 1, 5: 909-14.
- Baum N et tal. Blood urea nitrogen and serum creatinine. Urology 1975; 5, 5: 583-88.
- Witting MD et tal. ED predictors of upper gastrointestinal tract bleeding in patients without hematemesis. Am J Emerg Med 2006; 24, 3: 280-85.
- Aronson D et tal. Elevated blood urea nitrogen level as a predictor of mortality in patients admitted for decompensated heart failure. The Am J Med 2004; 116, 7: 466-73.
- Mehta AR. Why does the plasma urea concentration increase in acute dehydration? Advances in physiology education 2008; 32, 4: 336.
- Lum G et tal. Significance of low serum urea nitrogen concentrations. Clin Chem 1989; 35, 4: 639-40.
- Kalhan SC. Protein metabolism in pregnancy. Am J Clin Nutr 2000; 71, 5 Suppl: 1249S-55S.
- Salek J et tal. Recurrent liver failure in a 25-year-old female. Liver transplantation: official publication of the American Association for the Study of Liver
Diseases and the International Liver Transplantation Society 2010; 16, 9: 1049-53.
May contain information that is not supported by performance and intended use claims of Radiometer's products. See also Legal info.


Acute care testing handbook
Get the acute care testing handbook
Your practical guide to critical parameters in acute care testing.
Download now
Scientific webinars
Check out the list of webinars
Radiometer and acutecaretesting.org present free educational webinars on topics surrounding acute care testing presented by international experts.
Go to webinars