Printed from acutecaretesting.org
April 2009
Using "lean" process mapping to integrate testing to point(s) of care in the clinical enterprise


"LEAN" AT THE POINT OF CARE
There has been a great deal written the last few years about "lean" principles being applied to the overall testing process in the clinical laboratory [1]. Less has been written about "leaning" lab testing performed at the point of service. Point-of-care testing (POCT), in many regards, is an innately "lean" process [2].
The very nature of POCT performed in the presence of the patient and frequently provider with "just in time" single test analysis epitomizes "lean". Understanding the step-by-step POCT process leads one to identify several aspects that fit the "lean" definition. Fig. 1 shows these many aspects of point-of-care testing that are innately "lean".
FIGURE 1: Point-of-care testing is innately "lean" – points to ponder
|
"LEAN" PROCESS MAPPING
The practicing clinical laboratorian is more interested in the practical applied rather than theoretical aspects of "lean". It is intuitive to many point-of-care coordinators that "lean" principles come into play as testing migrates to the point of care.
It is important that these aspects of "leanness" are identified and made part of the justification process as point-of-care clinical applications emerge. While point-of-care testing may be more expensive from a laboratory per-unit cost aspect, the overall financial and clinical impact of migrating a test to point of care may be completely justified when one understands the overall process improvement.
One of the first steps of justifying a test being performed at the point of care is mapping the entire process from test order to receipt of results with detailed description of steps [3]. Point-of-care coordinators who understand the operation of their testing are best equipped to process-map the step-by-step workflow in their area. One does not need to be a black belt "lean" expert to write down these steps and understand their impact upon process improvement.
"LEAN" IN INFORMATION TECHNOLOGY
As one understands the step-by-step process of a point-of-care test versus a central-lab test, one must also judge the impact of their integration into hospital and even larger clinical enterprise systems [4]. This is certainly true of integrating the overall clinical process into preexisting clinical enterprise information technology.
As one goes about "lean" process mapping, one must understand the branch points along the way of integrating workflow into clinical information systems. This integration becomes glaringly apparent when one maps the time at different workflow steps that different people spend at a keyboard or in front of a monitor inputting or reviewing pieces of information. A growing portion of "lean" process improvement involves improving the information system user interface.
There is a growing problem within the healthcare information technology enterprise of disconnected applications from various departments integrating into the enterprise [5]. Thus the design of integrated information systems must also be "lean".
If new information systems from the point of care are integrated into preexisting enterprises, they must be as seamless as possible. This seamlessness must apply not only to the physical connection of information system technology and hardware, but also to the user interface. The user interface must be integrated so that users are not hopping or toggling to different systems.
A seamless approach would favor having icons or preexisting displays for the user interface to monitor several different systems. The bottom line is that POCT must not be placed into an enterprise as its own freestanding system. POCT must be integrated and this is best accomplished using a "lean" approach.
AN EXAMPLE OF "LEAN" PROCESS MAPPING IN THE CARDIOVASCULAR OPERATING ROOM (CV/OR)
Creating "lean" process mapping and information technology integration is exemplified by a study recently performed at the Geisinger Medical Center in Danville, Pennsylvania. The decision whether to place point-of-care instruments or continue to support CV/OR with central STAT lab instruments necessitated a "lean" process-mapping study.
An initial interview with CV/OR surgeons indicated a 15-minute typical turnaround time for blood gases performed in a central lab connected by a pneumatic tube system. The central lab had been monitoring in-lab turnaround time that typically averaged 2.5 minutes.
The stated 15-minute total turnaround time came somewhat as a surprise, but with process mapping, various components of preanalytical and postanalytical process added up to this total.
Fig. 2 shows the various steps and component turnaround times that added up to the total 15-minute turnaround time. Initial observation of the CV/OR process allowed its breakdown into logical steps to be mapped and subsequently timed. Only a few hours on 2 days were required to gather this data. "Lean" process mapping need not be extensive but should be thorough to capture the overall process.
FIGURE 2: Components of blood gas turnaround time from "vein to brain" ("V to B")
|
One can see that there was a large component of preanalytical process in the CV/OR that required time before the specimen was even launched in the pneumatic tube system to the central lab.
Observation and clocking of the process in the OR elucidated steps in this process, including information handoffs that were potential sources of preanalytical error. Likewise, result reporting back to the CV/OR, which was performed by intercom as well as followed by a computer system report, created a potential for error.
Similar to the order-entry process, the results-reporting process needed to be mapped and optimized for user efficiency. Results returned to the perfusionist in the CV/OR needed to be integrated into their field of view as they attend to their key perfusion duties.
Formatting of blood gas results needed to be readily viewable along with other key clinical processes during the CV/OR workflow. As can be seen in Fig. 3, the results should be returned to a console where undivided attention can be given during the pump process.
An icon on a perfusionist's console (in our case, a "databahn" console) is included as a flashing or highlighted icon when returned blood gas results are viewable. Clicking on this icon retrieves results in the same field of view as perfusion pump parameters.
FIGURE 3: Barcoded order entry at the "databahn" CV/OR workstation
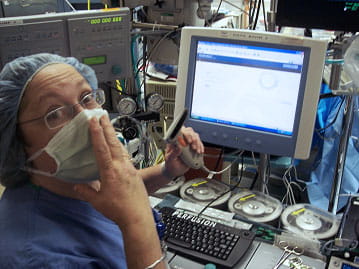
When observing and mapping the workflow process in the CV/OR, the laboratory was impressed with how busy perfusionists become during key times in CV surgery. Distractions are detrimental at these times, and return of blood gas results by intercom is suboptimal.
One may liken user order entry, results reporting and POCT hands-on processes in the CV-OR akin to using a GPS versus a paper map when driving through a busy city. Certainly one needs to keep one's eyes on the road and not fumble along with finding directions on a map in one's lap.
Typically the GPS shares the field of view and is not a distraction during intense workflow. As a matter of fact, actually performing point-of-care testing may be viewed as a distraction during key busy times of CV/OR surgery. A perfusionist should never be distracted when the possibility of pumping air into a patient exists.
It is through thorough process evaluation that CPOCT decisions may be made whether to model a "lean" centralized diagnostic process versus a "lean" POCT process. In this particular "lean" process mapping project, the decision was to pursue and prototype the former model.
INFORMATION TECHNOLOGY SOLUTIONS
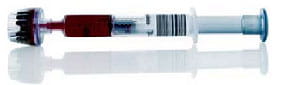
In looking at information technology solutions to this rather complex workflow, many information technology solutions emerged. Using preidentified specimen syringes, syringes, enabled a paperless order entry system as a perfusion technologist barcode-wanded a syringe, the patient identifier barcode and the operator barcode number in a "1-2-3" fashion (see Fig. 4).
As the syringe arrived in the lab, the instrument scanned its barcode, performed the tests ordered and returned results to the "databahn" console. The instrument also generated an order to the LIS for archiving of results and tracking of charges.
FIGURE 4
1. Patient barcode:

2. Syringe barcode:
As one designs a local "lean" process, one must view integrative aspects of the process into more broad enterprises. In this use case scenario, an enterprise-wide network will enable copies of this "lean" blood gas prototype to be expanded to multiple CV/ORs at multiple hospitals via an enterprise network server.
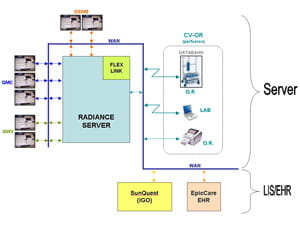
Fig. 5 shows how the enterprise server may serve to create identical information technology solutions at three hospitals that are integrated into the laboratory information system in the Geisinger enterprise. Having one enterprise server solution enables rapid and thorough standardization and greatly diminishes maintenance as one server is shared among hospitals. This type of detailed process evaluation and mapping has become a standard of practice as other applications are studied.
FIGURE 5: Integration of CV/OR prototype on an enterprise network with enterprise server
"LEAN" PROCESS MAPPING OF POCT AT ANTICOAGULATION CLINICS
Another point-of-care testing application which has greatly benefited from process mapping is use of point-of-care prothrombin time testing (PTINR) devices for decentralizing anticoagulation clinics. A 7-10 minute coagulation clinic visit is the norm at eight decentralized locations in central Pennsylvania, USA, each of which sees up to 35 patients per day. A single pharmacist at each location performs fingerstick PTINR testing and incorporates it into a clinic visit.
The step-by-step process includes patients registering at entrance lobbies of the sites by touching a screen and swiping a card at a kiosk (www.geisinger.org/locations/gw/mv/). This registration alerts the pharmacist that a patient has arrived to be seen. The pharmacist typically greets the patients as they enter the waiting area and ushers them into the pharmacist's office.
The pharmacist then initiates the fingerstick PTINR testing as he/she gathers patient history. This can include a few minutes of socialization as the pharmacist waits for the PTINR result to occur real-time on the testing device. As the patient history is compared with results of the PTINR, the pharmacist decides on whether Coumadin anticoagulation-dose adjustment is required.
The pharmacist then pulls out a colored index card that matches the color of the Coumadin-dose pill that is dispensed to the patient ("lean" design also employs visual tools) and writes down the next scheduled appointment date and the PTINR result on this card. This informative card is taken home in pocket or purse and supplements the full electronic record of the clinic encounter.
This "lean" 7-10 minute anticoagulation clinic visit is a great patient satisfier and may be viewed as "lean" in terms of saving both the patient's as well as the coagulation clinic's time.
In summary, by mapping processes that are under consideration for point-of-care testing, the laboratory learns a great deal about the clinical process and helps integrate it into the laboratory testing process. Once the process is mapped and understood, a rational decision may be made to centralize an improved "lean" process or to decentralize it to a POCT.
Information technology integration is key to this integration and benefits "lean" improvements that save time, reduce complexity and error and ultimately may generate substantial cost savings.
References+ View more
- Liker, J. The Toyota way: 14 management principles from the world's greatest manufacturer. McGraw Hill, 2004.
- Jones, J. Improving economic outcome with POCT: the "lean" perspective. Point of Care: The Journal of Near-Patient Testing & Technology. September 2008; 7: 3: 127.
- Kibak, P. Tools for benchmarking performance: how lean, six sigma improve lab efficiency and quality. Clinical Lab News 2008; 34: 4, 1.
- Astion, M. Engineers in the clinical laboratory. Clinical Lab News January 2009; 12-14.
- Paxton, A. Point-of-care sagas: tale of three cities. CAP Today January 2009; 23: 1, 1.
References
- Liker, J. The Toyota way: 14 management principles from the world's greatest manufacturer. McGraw Hill, 2004.
- Jones, J. Improving economic outcome with POCT: the "lean" perspective. Point of Care: The Journal of Near-Patient Testing & Technology. September 2008; 7: 3: 127.
- Kibak, P. Tools for benchmarking performance: how lean, six sigma improve lab efficiency and quality. Clinical Lab News 2008; 34: 4, 1.
- Astion, M. Engineers in the clinical laboratory. Clinical Lab News January 2009; 12-14.
- Paxton, A. Point-of-care sagas: tale of three cities. CAP Today January 2009; 23: 1, 1.
May contain information that is not supported by performance and intended use claims of Radiometer's products. See also Legal info.


Acute care testing handbook
Get the acute care testing handbook
Your practical guide to critical parameters in acute care testing.
Download now
Related webinar
Evolution of blood gas testing Part 1
Presented by Ellis Jacobs, PhD, Assoc. Professor of Pathology, NYU School of Medicine.
Watch the webinar