Printed from acutecaretesting.org
October 2002
A six sigma primer desc.


"Six Sigma" is the latest trend in quality management and is being widely implemented in business and industry today. Six Sigma will be coming to healthcare soon because business and industry are adopting "sigma metrics" as universal measures of quality to be applied to their processes as well as the processes of their suppliers.
Healthcare providers can expect to be included in their list of suppliers and to be held accountable for providing quantitative measures of quality. Likewise, healthcare providers will expect their diagnostics suppliers to provide sigma metrics to describe the quality of the products they purchase. Everyone, including our patients, will soon be using sigma metrics as their measures of quality!
Six Sigma represents an evolution of Total Quality Management (TQM), providing a more quantitative framework for evaluating process performance and clearer goals for process improvement. The principles of Six Sigma go back to Motorola's approach to TQM a decade ago.
Many of the leaders of Six Sigma, such as Harry and Schroeder [1], originally worked for Motorola. Motorola established a goal that 6 sigmas or standard deviations of process variation should fit within the tolerance limits for the process, hence the name Six Sigma.
 |
FIG. 1 |
Sigma metrics
The Six Sigma goal for process performance is illustrated in Fig. 1, which shows an error distribution of a measurement procedure that fits well within the tolerance specifications or quality requirements for that measurement.
For laboratory measurements, it is easy to calculate the sigma performance of a method from the imprecision (SD or CV) and inaccuracy (bias) observed for a method and the quality requirement (allowable total error, TEa) for the test [Sigma = (TEa - bias)/SD].
For example, this figure could describe pH where the test has a quality requirement of 0.04 pH units (i.e. the US CLIA criterion for acceptable performance) and the method has a bias of 0.00 and a standard deviation of 0.0067. The sigma metric for this pH method would be approximately 6.0 [(0.04 - 0.00)/0.0067].
Sigma scale
The power of Six Sigma comes from having a universal measure of process performance on the "sigma scale" to facilitate benchmarking across industries. The Six Sigma methodology can be applied broadly anytime the outcome of a process can be measured.
For processes where poor outcomes can be counted as errors or defects, the defects are expressed as defects per million (DPM), then converted to a sigma metric using a standard table available in any Six Sigma text [1]. At this time when outcomes are of great interest in healthcare, Six Sigma provides a general methodology to describe process outcome on the sigma scale.
To illustrate this calculation, consider the well-known problem with Firestone tires on Ford SUVs (sport-utility vehicles) in the US. A poor outcome, or defect, can be defined as a tire blowout that causes an accident.
Using data available to the public, there have been 2000 accidents in vehicles equipped with 6,000,000 tires, therefore the defect rate is 333 DPM (2000/6,000,000 × 1,000,000). Using DPM in the Sigma conversion table [1], this figure corresponds to 4.9-sigma performance.
Probably only a few processes in healthcare perform as well as Firestone tire production! You may find that statement shocking, but error rates of 1 % to 2 % are commonly considered acceptable for healthcare processes. Those error rates correspond to 10,000 to 20,000 DPM or process performance of 3.8 to 3.6 sigma. We should be striving for error rates of 0.1 % (4.6 sigma) to 0.01 % (5.2 sigma) and ultimately 0.001 % (5.8 sigma).
Laboratory applications
The first paper about the use of sigma metrics in laboratory applications was published by Nevalainen et al [2] in the year 2000. The applications were related to pre- and postanalytical factors.
Order accuracy, for example, was observed to have an error rate of 1.8 %, or 18,000 DPM, which corresponds to 3.6-sigma performance. Hematology specimen acceptability showed a 0.38 % error rate, or 3,800 DPM, which is 4.15-sigma performance.
The best performance observed was for the error rate in laboratory reports, which was only 0.0477 %, or 477 DPM, or 4.80-sigma performance. The worst performance was TDM (therapeutic drug monitoring) timing errors of 24.4 %, or 244,000 DPM, which is 2.20-sigma performance.
For comparison or benchmarking purposes, Nevalainen cited the following figures. Airline baggage handling shows a 0.4 % error rate, or 4,000 DPM, which is 4.15-sigma performance.
Airline safety (from the normal system of random causes, not assignable causes such as the terrorist hijackings) has a very low fatality rate of 0.43 deaths per million passenger miles, which is better than 6-sigma performance. And, as illustrated earlier, Firestone tire production is near the 5-sigma performance level.
Laboratory method performance
Fortunately for laboratories, it is very easy to assess the performance of analytical testing processes on the sigma scale.
The maximum tolerance limits can be taken from performance criteria for external quality assessment programs or regulatory requirements (such as the US CLIA criteria for acceptable performance in proficiency testing); process variation and bias can be estimated from method validation experiments, peer-comparison data, proficiency testing results, and routine QC data.
To calculate the sigma metric, you can take the performance criterion, subtract the bias observed for your method, and divide by the SD or CV of your method.
As illustrated earlier for pH, a CLIA criterion of 0.4 pH units and an observed method SD of 0.067 pH units give a sigma metric of approximately 6.0 [0.4/0.067]. For pCO2 where the CLIA criterion is 5 mmHg, a method with a bias of 0.5 and a SD of 1.0 mmHg would be characterized as having 4.5-sigma performance [(5.0 - 0.5)/1.0]. For pO2, given a quality requirement of 10 % and a method bias of 1 % and CV of 3 %, the sigma metric is 3.0.
Sigma metrics from 6.0 to 3.0 represent the range from "best case" to "worst case". Methods with 6-sigma performance are considered "world class". Methods with sigma performance less than 3 are generally not acceptable for production by current industrial standards.
 |
FIG. 2 |
Implications for QC
A practical application of the Six Sigma concept is the assessment of the number of quality control samples and the type of quality control rules that are needed for measurement processes having different performance metrics [3].
Fig. 2 shows the size of the systematic error that needs to be detected in a process having 6-sigma performance.
At the point where there is a 5 % risk that a test result may not satisfy the quality requirement (i.e. the area in the tail exceeding the quality requirement is 5 % of the area of the whole distribution), the size of the systematic shift is equivalent to 4.35 times the standard deviation of the method.
Different QC procedures (e.g. different control rules and different numbers of control measurements) have different sensitivities or capabilities for detecting analytical errors.
Practical goals for QC performance are to achieve a probability of error detection of 0.90, i.e. a 90 % chance of detecting the critical-sized systematic error, while keeping the probability of false rejection at 0.05 or less, i.e. 5 % or lower chance of false alarms. These probabilities can be assessed from "power function" or "sigma metrics" graphs.
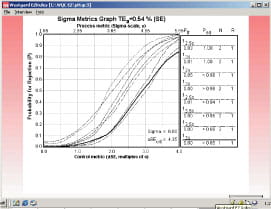 |
FIG. 3 |
Fig. 3 shows the sigma metrics graph for QC procedures commonly used in clinical laboratories. Probability for rejection is plotted on the y-axis versus the size of the systematic error on the x-axis. The different lines or power curves correspond to the control rules and the number of control measurements given in the key at the right (top to bottom).
The QC procedures shown here make use of one to three control measurements. Note that the "critical size" error of 4.35 is just off scale at the right on the x-axis.
All of the QC procedures shown here will give high error detection, e.g. the bottom line in the key represents a Levey-Jennings chart having 3 SD control limits and one control measurement, which will provide a probability of error detection greater than 0.85 and a probability of false rejection near 0.00. All the others provide even higher error detection, but some also have a higher false rejection rate (0.05 for 12s with N=1, as expected).
 |
FIG. 4 |
It is not always that easy, as shown by the pCO2 example in Fig. 4. Because this is a 4.5-sigma process, the size of the systematic error that needs to be detected is smaller - a shift equivalent to 2.85 times the standard deviation of the method. Smaller errors are more difficult to detect, requiring tighter control limits, multirule procedures, and/or higher numbers of control measurements.
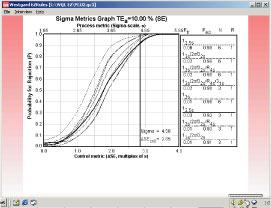 |
FIG. 5 |
The sigma metrics graph in Fig. 5 shows the power curves for QC procedures that provide the desired error detection. The key indicates that the number of control measurements varies from three to six.
The control rules include multirule combinations and a single rule with 2.5s control limits. The simplest QC procedure to implement would be the 12.5s rule with N=3, i.e. a Levey-Jennings control charting having control limits set at 2.5s and three control measurements per run.
 |
FIG. 6 |
The pO2 example has been chosen to illustrate the difficulties of controlling a method whose performance is minimal, i.e. a sigma of 3.0. Fig. 6 shows that the critical systematic error is only 1.35 times the standard deviation of the method. The sigma metrics graph in Fig. 7 shows that the probability of detecting an error of that size is only 0.76 even when using a multirule procedure with an N of 6.
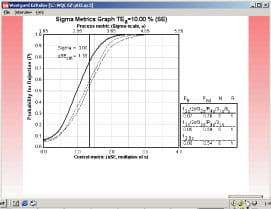 |
FIG. 7 |
In short, QC is very easy for a method with a sigma metric of 6.0, difficult but possible for a method with a sigma metric of 4.5, and very difficult to nearly impossible (or at least impractical) for a method with a sigma metric of 3.0. The simple calculation of the sigma metric provides immediate insight into the QC needed for a measurement process.
The addition of appropriate tools, such as the sigma metrics graph or charts of operating specifications (OPSpecs charts), will provide a quantitative process for the selection and design of QC procedures based on the quality required for the test and the imprecision and inaccuracy observed for the method [4].
Information technology can facilitate and automate the design and implementation of appropriate QC procedures [5].
Getting started with Six Sigma in your laboratory!
Since the core business of the laboratory is to produce accurate test results, it makes sense to first apply Six Sigma to your analytical processes. It is also the easiest application because there are tolerance limits in the form of acceptability criteria from peer-comparison and proficiency testing programs, QC data available for estimating method precision, and peer data available for estimating method bias.
Laboratories can later expand their efforts to preanalytical and postanalytical processes, knowing that their core processes are producing the needed quality.
For more detailed discussion of Six Sigma concepts and their application for establishing performance specifications and QC procedures for laboratory tests, see the following resources on the Westgard.com website:
-
Six Sigma quality management and desirable laboratory precision http://www.westgard.com/essay35.htm
-
Six Sigma quality management and requisite laboratory QC http://www.westgard.com/essay36.htm
-
Six Sigma quality design and control processes http://www.westgard.com/lesson67.htm
Westgard QC also provides a training manual and a workshop on Six Sigma quality design and control.
Many other organizations provide broad training in the Six Sigma problem solving methodology that is applicable to all areas of industry and healthcare.
See the website of the American Society for Quality (www.ASQ.org) and their Quality Progress magazine for training sources.
References+ View more
- Harry M, Schroeder R. Six Sigma: The breakthrough management strategy revolutionizing the world's top corporations. New York: Currency, 2000.
- Nevalainen D, Berte L, Kraft C, Leigh E, Morgan T. Evaluating laboratory performance on quality indicators with the six sigma scale. Arch Pathol Lab Med 2000; 124: 516-19.
- Westgard JO. Six Sigma quality design and control: Desirable precision and requisite QC for laboratory testing processes. Madison, WI: Westgard QC, Inc., 2001.
- Westgard JO. Charts of operational process specifications ("OPSpecs charts") for assessing the precision, accuracy, and quality control needed to satisfy proficiency testing performance criteria. Clin Chem 1992; 38: 1226-23.
- Westgard JO. IT for automating the QC process. Blood Gas News 2000; 9: 13-17.
References
- Harry M, Schroeder R. Six Sigma: The breakthrough management strategy revolutionizing the world's top corporations. New York: Currency, 2000.
- Nevalainen D, Berte L, Kraft C, Leigh E, Morgan T. Evaluating laboratory performance on quality indicators with the six sigma scale. Arch Pathol Lab Med 2000; 124: 516-19.
- Westgard JO. Six Sigma quality design and control: Desirable precision and requisite QC for laboratory testing processes. Madison, WI: Westgard QC, Inc., 2001.
- Westgard JO. Charts of operational process specifications ("OPSpecs charts") for assessing the precision, accuracy, and quality control needed to satisfy proficiency testing performance criteria. Clin Chem 1992; 38: 1226-23.
- Westgard JO. IT for automating the QC process. Blood Gas News 2000; 9: 13-17.
May contain information that is not supported by performance and intended use claims of Radiometer's products. See also Legal info.


Acute care testing handbook
Get the acute care testing handbook
Your practical guide to critical parameters in acute care testing.
Download now
Scientific webinars
Check out the list of webinars
Radiometer and acutecaretesting.org present free educational webinars on topics surrounding acute care testing presented by international experts.
Go to webinars