Printed from acutecaretesting.org
May 2016
D-dimer assays - pitfalls of analytical comparisons


SummaryWhen a new D-dimer method is evaluated, it’s typically compared to an established D-dimer method using both an analytical and a clinical comparison.
Analytical comparisons should be discouraged, as they do not give any useful information about the potential clinical usability of the assay. D-dimer assay comparisons should be based on clinical performance where the same samples are measured with all the methods compared.
INTRODUCTION
New D-dimer methods are typically evaluated by comparing them to an established D-dimer method. Usually both an analytical and a clinical comparison are made.
Comparing D-dimer assays is challenging.
A clinical comparison where the clinical truth is known for the tested population should be the focus of the method evaluation.
The challenges are related to the fact that D-dimer is not a standardized method1.
Even now, 15 years after the Fibrin Assay Comparison Trial (FACT), we still have neither a common calibrator nor standard material for the many different D-dimer assays that are commercially available2.
This causes a number of analytical and interpretational problems because the specificity of the antibodies differs markedly, and therefore establishing D-dimer commutability among clinical samples is still regarded as an essential issue3.
The challenge comes from the fact that the D-dimer molecules belong to a heterogeneous group of molecules, where the only defining characteristic of the D-dimer antigen is the so called D-dimer motif.
D-dimer molecules are generated through the degradation of fibrin by plasmin.
The D-dimer motif is found in various fractions from high molecular weight products to low molecular products and the mix between high molecular and low molecular weight products will depend on the status of ongoing coagulation and fibrinolysis.
The predominant reasons for discrepancies between D-dimer assays seem to be related to differences in antibody specificity, especially concerning the assay antibodies affinity for high or low molecular weight degradation products2.
Additional variability arises from differences in specificity for crosslinked over non-crosslinked degradation products, and these discrepancies form the background for the wide range of clinical specificities - from 30 % to above 90 % - that is seen between D-dimer assays4,5.
As the percentage of false-positives is equal to 100 % minus specificity, it means that D-dimer testing of patients suspected with venous thromboembolism (VTE) is associated with a relatively high fraction of false-positives.
This is considered acceptable because D-dimer testing is used for ruling out VTE in low-risk patients, and that patients with a positive test are examined with a confirmatory method (imaging)6.
Discrepancies between various studies of the same assays are predominantly related to differences between study populations. Prevalence of VTE may differ between studies and thus the mix between high molecular and low molecular weight products will differ.
In addition, the study population may vary, and many patients with cancer, old age, hospitalization, infection/inflammation and many other conditions may have elevated D-dimer concentration without having VTE7,8,9.
The mixture of these conditions is most often not known or fully disclosed in published studies.
Including patient groups with a high incidence rate of elevated D-dimer due to other causes than VTE will have a strong negative influence on the ascertained specificity of an assay.
At the same time, the occurrence of DVT in these patients gives a false increase in the measured clinical sensitivity if the D-dimer result is elevated, regardless of the DVT diagnosis.
Discrepancies between methods and studies mean that you cannot directly compare two analytical results obtained with different methods.
We have experienced that D-dimer assay correlation studies are too often presented, and the analytical comparison is interpreted, in a misleading way in literature, as a measure for the clinical usability of methods.
COMPARISONS OF D-DIMER METHODS
Numerous studies evaluating the performance of D-dimer assays used as an aid in the diagnosis of venous thromboembolism have been published.
In some studies the performance assessment is done based on a comparison to another D-dimer assay, usually an assay that the authors have used for a longer period and trust10,11,12.
But what is the value of an assessment of performance and usefulness of a D-dimer assay when the assessment is based solely on comparison to another assay?
In the following we will give examples of why analytical comparisons based on correlations and their slopes and intercepts may lead to faulty conclusions.
Let us look at three hypothetical assays as presented in Table 1, which we will call Assay 1, Assay 2 and Assay 3.
The clinical performance of these assays is within the ranges typically seen4,5,12 and all use the same diagnostic cut-off of 500 µg/L:
Table 1: Characteristics of three hypothetical D-dimer assays
| Assay name | Assay 1 | Assay 2 | Assay 3 |
| Sensitivity (%) | 100 | 95 | 95 |
| Specificity (%) | 45 | 45 | 60 |
Let us assume that we test a population with 200 individuals and a VTE prevalence of 10 %, meaning that 20 of these individuals have proximal VTE, and 180 do not have VTE.
Based on the sensitivity and specificity of the assays we calculate how many true positive, false negative, true negative and false positive results we theoretically will get with each assay (Table 2).
Table 2: Test performances
| Sens, % | Spec, % | True positive # | False negative # | True negative # | False positive # | |
| Assay 1 | 100 | 45 | 20 | 0 | 81 | 99 |
| Assay 2 | 95 | 45 | 19 | 1 | 81 | 99 |
| Assay 3 | 95 | 60 | 19 | 1 | 108 | 72 |
To simplify the examples, related to analytical comparisons, that may lead to a misleading conclusion about assay performance, we will assume that all the samples that are true negative with Assay 1 are also true negative with Assay 2 and Assay 3, and that all samples that are true positive with Assay 2 are also true positive with Assay 1 and Assay 3.
We will make method comparisons and concentrate on the clinically relevant area of the graph surrounding the cut-off values (see Figure 1 for reference). We can easily visualize the analytical discrepant results between the assays by dividing the graph into four sections, which represent the following occurances:
• Section A: Result is negative with method on X-axis and positive with method on Y-axis
• Section B: Result is positive with both methods
• Section C: Result is negative with both methods
• Section D: Result is positive with method on X-axis and negative with method on Y-axis
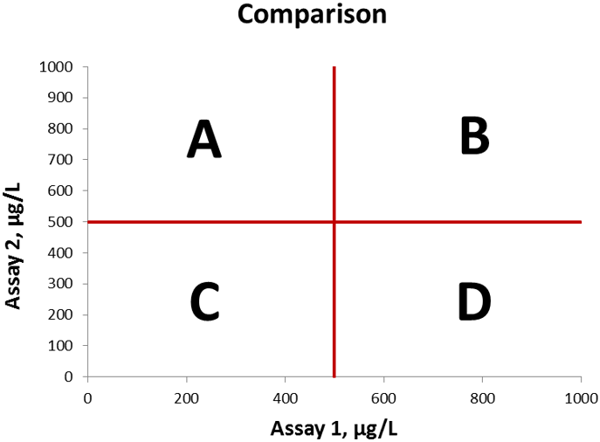
Figure 1 Method comparison graph, cut-off values indicated in red lines. The four sections A, B, C, and D are indicated in the graph
On Figure 2 we compare Assay 1 and Assay 2. Linear regression analysis gives a slope of 0.96, an intercept of -4 µg/L, and a correlation coefficient is 0.906.
The coefficient of correlation is high taking into consideration that D-dimer assays generally do not compare well, due to the many reasons explained above.
The only analytically discrepant result in this example, is a patient sample that tested with a false negative result for assay 2 but was true positive with assay 1, which therefore falls in section D on the graph.
In section C we have 81 data points representing the 81 samples that are true negative with both assays.
In section B we have 118 data points representing the 19 samples that are true positive with both assays plus 99 samples that are false positive with both assays.
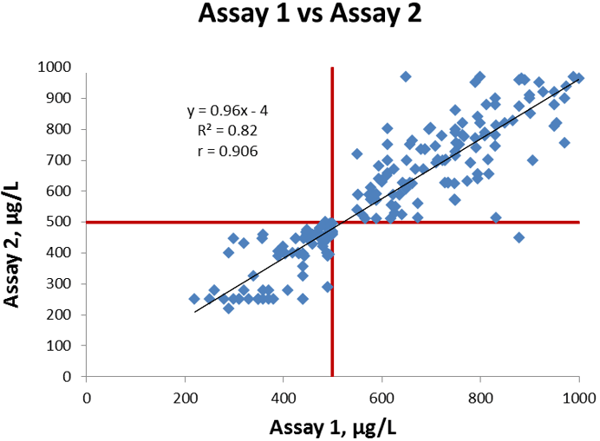
Figure 2 Comparison of Assay 1 vs Assay 2, cut-off values indicated in red lines.
This correlation situation is similar to many comparisons in literature. As described above, the correlation is good as the slope is close to 1, the intercept is less than 1 % of the cut-off value, and the coefficient of correlation is high.
As there is only one out of a total of 200 samples that gives a discrepant result (positive with one method, negative with the other method), the overall agreement is also very good.
The calculated bias of Assay 2 compared to Assay 1 at the cut-off is -24 µg/L.
Now we will compare Assay 1 and Assay 3. Figure 3 shows the linear regression between the assays; we get a slope of 0.78, intercept of +50 µg/L and a correlation coefficient is 0.693.
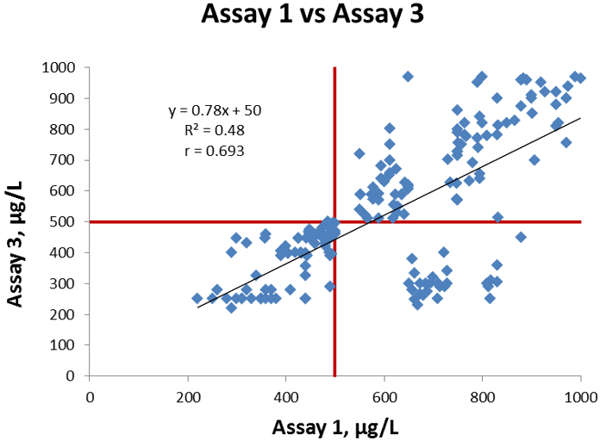
Figure 3 Comparison of Assay 1 vs Assay 3, cut-off values indicated in red lines.
The coefficient of correlation is lower than in our former comparison and also visually there are a larger number of discrepant results between the two methods. There are 28 data points in section D.
They represent one sample that is false negative with Assay 3 and true positive with Assay 1, and in addition 27 samples that are true negative with Assay 3 and false positive with Assay 1.
In section C we have 81 data points representing the 81 samples that are true negative with both assays. In section B we have 91 data points representing the 19 samples that are true positive with both assays, plus 72 samples that are false positive with both assays.
This correlation situation is also similar to many comparisons in literature.
The correlation is moderate and 28 out of a total of 200 samples (~14 %) give analytically discrepant results (positive with one method, negative with the other method) so the overall agreement is not as good as it was in the former comparison we made.
The calculated bias of Assay 3 compared to Assay 1 at the cut-off is -60 µg/L.
Now what is the difference between these two comparisons? The difference is that Assay 3 has a higher specificity (60 %) than Assay 2 (45 %).
The only difference between the data sets, is that 27 samples that were false positive with Assay 2 and Assay 1 now are true negative with Assay 3.
It means that 27 data points have moved from section B to section D. All the other data points did not move!
CONCLUSION
We can see that Assay 1 is a good assay. The sensitivity is 100 % and the specificity is 45 %, which is within the ranges typically seen4,5,12 in D-dimer assays widely in use in clinical settings today.
The question is, if we assume that assay 1 is used as a golden standard, can we use the two comparisons just shown to estimate whether assay 2 is better than assay 3? The answer is clearly “no”.
The correlation, the total agreement and the bias can all be considered better in the first comparison, the Assay 1 vs Assay 2 comparison. Does this mean that Assay 3 is not as good as Assay 2? Absolutely not.
Assay 3 is better than Assay 2 because it has the same sensitivity, but a higher specificity. The higher specificity means that fewer patients will need confirmatory investigations.
This is more convenient for the patients who can be ruled-out at once and it also means cost savings for the hospital13.
The correlation, the slope and intercept and the bias at the cut-off, do not give information that can be used to assess which of two or more assays is the better assay.
We have seen that a higher specificity can give a lower slope and a higher negative bias at cut-off.
However, this does not give us any usefull information about the potential clinical usability of the assay.
Therefore D-dimer assay comparisons should be based on clinical performance, where the same samples are measured with all the methods compared.
Analytical comparisons should not be made.
In addition, it should be kept in mind that a comparison based on results obtained with all assays on the same samples can only be used to compare the relative performances of the assays in the studied population.
The relative performances may be different if the assays are tested on another population with a different prevalence, a different spectrum of disease, etc
Read more about d-dimer:
- Causes of increased D-dimer
- Age-adjustment of the D-dimer cut-off value to improve the exclusion of thromboembolic events in older patients
- The clinical use of a D-dimer assay
- Comparing D-dimer assays using likelihood ratios and Fagan nomograms
- Assessment of plasma D-dimer as a diagnostic and prognostic aid for abdominal aortic aneurysm
- The role of D-dimer in diagnosis of venous thromboembolism – a review
References+ View more
- Dempfle CE. Validation, calibration, and specificity of quantitative D-dimer assays. Semin Vasc Med 2005; 5(4): 315-2
- Dempfle CE, Zips S, Ergül H, Heene DL and the FACT study group. The assay comparison Trial (FACT). Evaluation of 23 quantitative D-dimer assays as basis for the development of D-dimer Calibrators. Thromb Haemost 2001; 85: 671-8
- Longstaff C, Adcock D, Olson JD et al. Harmonisation of D-dimer - A call for action. Thromb Res 2016; 137: 219-20
- Heim SW, Schectman JM, Siadaty MS et al. D-dimer testing for deep venous thrombosis: a metaanalysis. Clin Chem 2004; 50(7): 1136-47
- Philbrick JT, Heim S. The D-dimer test for deep venous thrombosis: gold standards and bias in negative predictive value. Clin Chem 2003; 49(4): 570-74
- Wells PS, Anderson DR, Rodger M et al. Evaluation of D-dimer in the diagnosis of suspected deep-vein thrombosis. N Engl J Med 2003; 349: 1227-35
- Brotman DJ, Segal JB, Jani JT et al. Limitations of D-dimer testing in unselected inpatients with suspected venous thromboembolism. Am J Med 2003; 114: 276-82
- Dempfle CE. D-dimer testing and venous thromboembolism: four view points. J Thromb Haemost 2005; 3: 377-79
- Harper PL, Theakston E, Ahmed J et al. D-dimer concentration increases with age reducing the clinical value of the D-dimer assay in the elderly. Intern Med J 2007; 37(9): 607-13
- Antovic JP, Höög Hammerström K, Forslund G et al. Comparison of five point-of-care D-dimer assays with the standard laboratory method. Int Jnl Lab Hem 2012; 34: 495-501
- Perveen S, Unwin D, Shetty AL. Point of care D-dimer testing in the emergency department: a bioequivalence study. Ann Lab Med 2013; 33(1): 34-8
- Oude Elferink RF, Loot AE, Van De Klashorst CG et al. Clinical evaluation of eight different D-dimer tests for the exclusion of deep venous thrombosis in primary care patients. Scand J Clin Lab Invest 2015; 75(3): 230-8
- Nelson CM, Wright GS, Silbaugh TR et al. Improving D-dimer Positive Predictive Value for Outpatients with Suspected Deep Vein Thrombosis. Perm J 2009; 13(1): 4-7
References
- Dempfle CE. Validation, calibration, and specificity of quantitative D-dimer assays. Semin Vasc Med 2005; 5(4): 315-2
- Dempfle CE, Zips S, Ergül H, Heene DL and the FACT study group. The assay comparison Trial (FACT). Evaluation of 23 quantitative D-dimer assays as basis for the development of D-dimer Calibrators. Thromb Haemost 2001; 85: 671-8
- Longstaff C, Adcock D, Olson JD et al. Harmonisation of D-dimer - A call for action. Thromb Res 2016; 137: 219-20
- Heim SW, Schectman JM, Siadaty MS et al. D-dimer testing for deep venous thrombosis: a metaanalysis. Clin Chem 2004; 50(7): 1136-47
- Philbrick JT, Heim S. The D-dimer test for deep venous thrombosis: gold standards and bias in negative predictive value. Clin Chem 2003; 49(4): 570-74
- Wells PS, Anderson DR, Rodger M et al. Evaluation of D-dimer in the diagnosis of suspected deep-vein thrombosis. N Engl J Med 2003; 349: 1227-35
- Brotman DJ, Segal JB, Jani JT et al. Limitations of D-dimer testing in unselected inpatients with suspected venous thromboembolism. Am J Med 2003; 114: 276-82
- Dempfle CE. D-dimer testing and venous thromboembolism: four view points. J Thromb Haemost 2005; 3: 377-79
- Harper PL, Theakston E, Ahmed J et al. D-dimer concentration increases with age reducing the clinical value of the D-dimer assay in the elderly. Intern Med J 2007; 37(9): 607-13
- Antovic JP, Höög Hammerström K, Forslund G et al. Comparison of five point-of-care D-dimer assays with the standard laboratory method. Int Jnl Lab Hem 2012; 34: 495-501
- Perveen S, Unwin D, Shetty AL. Point of care D-dimer testing in the emergency department: a bioequivalence study. Ann Lab Med 2013; 33(1): 34-8
- Oude Elferink RF, Loot AE, Van De Klashorst CG et al. Clinical evaluation of eight different D-dimer tests for the exclusion of deep venous thrombosis in primary care patients. Scand J Clin Lab Invest 2015; 75(3): 230-8
- Nelson CM, Wright GS, Silbaugh TR et al. Improving D-dimer Positive Predictive Value for Outpatients with Suspected Deep Vein Thrombosis. Perm J 2009; 13(1): 4-7


Register for the related webinar
The Benefit of Using a D-dimer Assay with a High Clinical Specificity
Presented by Karin Strandberg, MD, PhD, Assoc. Prof.
Join the webinar
Acute care testing handbook
Get the acute care testing handbook
Your practical guide to critical parameters in acute care testing.
Download now
Scientific webinars
Check out the list of webinars
Radiometer and acutecaretesting.org present free educational webinars on topics surrounding acute care testing presented by international experts.
Go to webinars