Printed from acutecaretesting.org
October 2008
Parameters that reflect the carbon dioxide content of blood


All tissue cells depend on aerobic metabolism for generation of the energy (in the form of adenosine tri-phosphate, ATP) required for survival and function. This fundamentally vital mitochondrial process is characterized by consumption of oxygen and production of carbon dioxide, which can vary from around 200 mL/minute in the resting state to over five times this rate during exercise.
The ultimate fate of this carbon dioxide is elimination from the body in expired air, and an important function of blood is the transport of carbon dioxide from tissue cells to lungs.
An understanding of this transport process depends on an appreciation of what is meant by partial pressure of a gas as well as some basic physical laws that govern the solubility and movement (diffusion) of gases.
WHAT IS PARTIAL PRESSURE OF A GAS?
The amount of gas in a system, including biological systems, is defined by the pressure it exerts, traditionally measured as the height of a column of mercury (mmHg). Thus in saying that atmospheric pressure is 760 mmHg we mean that the gases (oxygen, nitrogen and carbon dioxide) in the air we breathe have a combined pressure sufficient to support a standard column of mercury 760 mm high.This total pressure is simply the sum of the partial pressures of each constituent gas. Thus since air comprises approximately 20 % oxygen, 79 % nitrogen and 0.03 % carbon dioxide, the partial pressure of oxygen (pO2) in inspired air is approximately (20 x 760) / 100 = 152 mmHg and partial pressure of carbon dioxide (pCO2) is (0.03 x 760) / 100 = 0.2 mmHg.
The systeme internationale (SI) unit of pressure, used in clinical laboratories outside of North America, is the kilopascal (kPa). The conversion factor 0.133 can be used to convert mmHg to kPa.
SOLUBILITY AND DIFFUSION OF GASES
Henry’s law [1] states that at equilibrium the amount of gas dissolved in a liquid is proportional to the partial pressure of that gas, so long as temperature is constant:Dissolved gas = partial pressure (p) x solubility coefficient (S)
Where S is a temperature dependant constant for the particular gas. The solubility coefficient (S) for carbon dioxide at body temperature is 0.23 mmol/L/kPa (or 0.03 mmol/mmHg) [1]. Thus since arterial pCO2 is approximately 5.3 kPa (40 mmHg), the amount of CO2 dissolved in arterial blood (dCO2) is (5.3 x 0.23) or 40 x 0.03) = 1.2 mmol/L.
The movement (diffusion) of gases is determined in large part by concentration gradients. Gas diffuses from high partial pressure to low partial pressure [1].
TRANSPORT OF CARBON DIOXIDE FROM TISSUE CELLS TO LUNG
The carbon dioxide journey (FIGURE 1a) begins in the mitochondrion of tissue cells where it is produced. Due to the prevailing concentration gradient carbon dioxide diffuses from mitochondria (where pCO2 is highest) across the cytoplasm, out of the cell and into the capillary network.
FIGURE 1a: CO2 in tissues
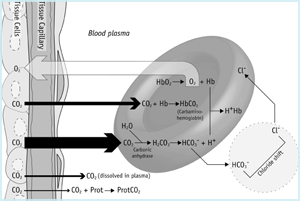
A little of the CO2 arriving in blood from tissue cells remains physically dissolved in blood plasma (see above) and an even smaller proportion binds to NH2 (amino) terminal groups of plasma proteins, forming so called carbamino compounds. Most however, diffuses down a concentration gradient into red cells.
A little of this remains dissolved in the cytoplasm of the red cell and some is loosely bound to amino terminal groups of reduced hemoglobin forming carbamino-Hb. However most of the carbon dioxide arriving in red cells is rapidly hydrated to carbonic acid by the red cell isoform of the enzyme carbonic anhydrase. At physiological pH almost all (≈ 96 %) of this carbonic acid dissociates to bicarbonate and hydrogen ions:
Equation 1:
![]()
The hydrogen ions are buffered by reduced hemoglobin and most of the bicarbonate ions pass from the red cell to plasma in exchange for chloride ions (this so called ‘chloride shift’ maintains electrochemical neutrality). It is clear from the above that most carbon dioxide is transported as bicarbonate (predominantly in blood plasma), but there are in total four modes of CO2 transport [1,2]:
- 90 % is transported as bicarbonate in plasma (65 %) and red cells (25 %)
- 5 % is transported physically dissolved in plasma and red cell cytoplasm
- 5 % is transported loosely bound to hemoglobin in red cells and < 1 % to proteins in plasma - so called carbamino compounds
- < 0.1 % is transported as carbonic acid
Total carbon dioxide blood content is the sum of these four components.
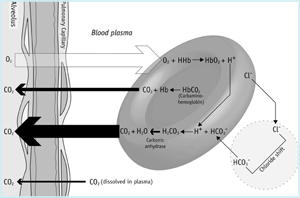
Within the microvasculature of the lungs (FIGURE 1b) the partial pressure gradient across the alveolar membrane determines that dissolved CO2 passes from blood to alveoli. This loss of carbon dioxide from blood favors reversal of the red cell reactions described above.
Thus bicarbonate passes from plasma to red cell, buffering hydrogen ions released from hemoglobin, as it is oxygenated. Reversal of the carbonic anhydrase reaction, results in production of CO2 that diffuses from red cells to plasma and onwards to alveoli.
Mixed venous blood arriving at the lungs has a total CO2 content of approximately 23.5 mmol/L (or 52 mL/dL) whereas arterial blood leaving the lungs has a total CO2 content of 21.5 mmol/L (48 mL/dL).
This arterio-venous difference (2 mmol/L or 4 mL/dL) represents the amount of CO2 added to blood from tissue cells and lost from blood as it passes through the pulmonary microvasculature, to be eventually excreted from the body in expired air.
FIGURE 1b: CO2 in lungs
CARBON DIOXIDE AND BLOOD PH
The acidic potential of CO2, due to its hydration reaction to carbonic acid (see equation 1 above), ensures that its concentration in blood is a major determinant of blood pH. As CO2 concentration rises, so too does hydrogen ion (H+) concentration. Regulation of blood CO2, that is matching the rate of CO2 elimination in expired air to the rate of production in the mitochondrion of tissue cells, essential for maintaining normal blood pH, is the business of the respiratory system.Respiration rate (controlled by pCO2 sensitive chemoreceptors located in the brain stem and carotid artery) is increased if pCO2 is rising and decreased if pCO2 is declining. Increased respiratory rate (breaths/min) results in increased rate of CO2 elimination and decreased respiratory rate promotes CO2 retention.
The relationship between pH and carbon dioxide is described by a form of the Henderson-Hasselbach equation (equation 2). This is derived from application of the law of mass action to the hydration and dissociation reactions described in equation 1 [1-3].
Equation 2:
![]()
where
| pK/1 | = | ‘apparent’ dissociation constant of carbonic acid = 6.1 |
| [HCO3-] | = | concentration of plasma bicarbonate (mmol/L) |
| S | = | solubility coefficient for CO2 at 37 oC (0.23 if pCO2 is measured in kPa or 0.03 if pCO2 measured in mmHg) |
| pCO2 | = | partial pressure of pCO2 (kPa or mmHg) |
As previously explained, the denominator in this equation (S x pCO2) is the amount of dissolved carbon dioxide (dCO2) mmol/L.
By removing all constants, equation 2 can be simplified to:
Equation 3:
pH ∞ [HCO3-] / pCO2
Thus pH of blood is dependant on the ratio of plasma bicarbonate concentration (the metabolic component) to pCO2 (the respiratory component). Thus if pCO2 increases without an equivalent rise in bicarbonate, pH falls. Conversely if pCO2 falls without an equivalent fall in bicarbonate, pH rises.
The reverse relationship holds for bicarbonate concentration viz increased HCO3– = increased pH; decreased bicarbonate = decreased pH.
Bicarbonate is the principle blood buffer and its concentration at any particular time reflects the balance between that produced from CO2 and that consumed in buffering hydrogen ions (H+) (see equation 1).
IN THE LABORATORY - DEFINITION OF CO2 PARAMETERS
The CO2 parameters generated by the blood gas analyzer are:- Partial pressure of carbon dioxide (pCO2) (kPa/mmHg)
- Plasma bicarbonate concentration (HCO3-) (mmol/L)
- Plasma total concentration carbon dioxide (ctCO2) (mmol/L)
The last of these, ctCO2, can also be measured in plasma or serum by chemical methods independent of the blood gas analyzer.
PARTIAL PRESSURE OF CARBON DIOXIDE pCO2
This parameter is a measure of the pressure exerted by that small portion (≈ 5 %) of total carbon dioxide in blood that remains in the gaseous state, ‘dissolved in’ the aqueous phase of plasma and blood cell cytoplasm. The measurement is made using a CO2 specific pH electrode incorporated in blood gas analyzers.In health pCO2 of arterial blood is maintained within the range 4.7-6.0 kPa (35-45 mmHg); pCO2 of venous blood is a little higher 5.6-6.8 kPa (41-51 mmHg).
BICARBONATE CONCENTRATION (HCO3-)
This is the quantity of bicarbonate in unit volume of plasma. As previously noted, this is the form in which most carbon dioxide (90 %) is transported in blood. This parameter cannot be measured but is generated by calculation during blood gas analysis. The calculation used is a rearrangement of equation 2:Equation 4:
| log [HCO3-] = pH + log (S x pCO2) - pK/1 |
and depends on having values for pH and pCO2, both of which are measured during blood gas analysis.
Theoretically plasma bicarbonate is the difference between total CO2 (ctCO2) and the sum of all other forms of CO2 in plasma, i.e. dissolved CO2 (dCO2), CO2 bound to plasma proteins (carbamino CO2) and carbonic acid (H2CO3).
Thus:
| Plasma bicarbonate (mmol/L) = |
| ctCO2 - (dCO2 + carbamino-CO2 + H2CO3) |
In practice because carbamino-CO2 and H2CO3 are quantitatively insignificant an assumption is made that total CO2 is the sum of just bicarbonate and dissolved CO2 [4]. Thus plasma bicarbonate is effectively the difference between plasma total CO2 (ctCO2) and plasma dissolved CO2 (dCO2).
In health arterial plasma bicarbonate (as calculated during blood gas analysis) is maintained within the approximate reference range: 22-28 mmol/L. Venous bicarbonate is a little higher: 24-30 mmol/L.
In some laboratories a distinction is made between ‘actual’ bicarbonate (the parameter described above) and ‘standard’ bicarbonate. Standard bicarbonate is a second calculated parameter and is the plasma bicarbonate concentration of blood that has been equilibrated with gas of normal pCO2 (40 mmHg, 5.3 kPa) tension [5].
In health then actual bicarbonate concentration is the same as standard bicarbonate concentration because in both instances pCO2 is normal. By normalizing pCO2, the respiratory component of acid-base balance, standard bicarbonate is a measure solely of the metabolic component and is therefore considered helpful for elucidating the cause of complex disturbances in acid-base balance.
TOTAL CARBON DIOXIDE CONCENTRATION IN PLASMA (ctCO2)
This is theoretically the sum of all forms of carbon dioxide in plasma. It is not measured during blood gas analysis, but - like bicarbonate - calculated, assuming as above that the total carbon dioxide is the sum of bicarbonate and dissolved CO2:Since plasma dCO2 mmol/L = (S x pCO2), ctCO2 is calculated thus [4]:
| plasma ctCO2 (mmol/L) = |
| plasma bicarbonate (mmol/L) + (S x pCO2) (mmol/L) |
Dissolved CO2 (S x pCO2) contributes approximately 1.2 mmol/L to the total CO2 in the plasma of arterial blood (see above), so that ctCO2 is around 1.2 mmol higher than plasma bicarbonate. The ctCO2 reference range is thus approximately 23-29 mmol/L for arterial blood.
It will be noted that just as the calculated bicarbonate value generated during blood gas analysis depends on the relationship described in equation 2, so too does the calculated value for ctCO2 generated during blood gas analysis.
Although ctCO2 and bicarbonate provide equivalent clinical information, in clinical practice it is invariably bicarbonate rather than ctCO2 that is used in conjunction with pH and pCO2 to evaluate acid-base status. The clinical value of calculated ctCO2 generated during blood gas analysis is thus limited.
CHEMICAL METHODS FOR MEASURING ctCO2
Unlike bicarbonate, which cannot be measured, ctCO2 can and the assay is commonly one component of the urea and electrolyte (U&E) profile of venous plasma/serum. Since U&E is ordered much more frequently than arterial blood gases, measured ctCO2 can be the first indication of disturbance in carbon dioxide (and therefore acid-base) homeostasis.It is common practice for some clinical laboratories to refer to this measured component of the U&E profile as ‘plasma bicarbonate’. This is erroneous because chemical methods measure all CO2 liberated from plasma (or serum) by addition of strong acid or alternatively all bicarbonate produced as a result of adding a strong alkali to plasma [6].
It thus includes not only bicarbonate, but also dissolved CO2 and carbonic acid. If plasma or serum used in these assays were derived from arterial blood then measured ctCO2 would theoretically approximate to the calculated ctCO2 value generated during arterial blood gas analysis.
In fact U&E profiles are exclusively performed on plasma or serum recovered from venous blood so that there is an inevitable small theoretical difference of 1-2 mmol/L (measured ctCO2 > calculated ctCO2) due to arterio-venous difference.
The theoretical difference between measured ctCO2 and calculated plasma bicarbonate is a little higher (measured ctCO2 > calculated plasma bicarbonate) because in addition to the arterio-venous difference of 1-2 mmol/L there is a further 1.5 mmol/L difference due to the inclusion of dissolved CO2 and carbonic acid in measured ctCO2.
However this difference presupposes that no dissolved carbon dioxide is lost to the atmosphere prior to analysis. This might not be the case because U&E samples are not handled anaerobically.
Some [20] have argued that the term ‘serum/plasma bicarbonate’ for measured ctCO2 is justified on the grounds that normal laboratory practice is associated with an inevitable loss of dissolved CO2 from the U&E sample prior to analysis, in which case measured ctCO2 would, theoretically at least, approximate to calculated bicarbonate.
DISCORDANCE BETWEEN MEASURED ctCO2 AND CALCULATED BICARBONATE
Notwithstanding the slight theoretical differences between measured and calculated values outlined above there is general acceptance of the notion that the measured ctCO2 generated as part of a U&E profile is for all practical clinical purposes the same as plasma bicarbonate concentration calculated during blood gas analysis.
This is reflected in the use of the term ‘plasma bicarbonate’ to describe measured ctCO2.
The best evidence to date that measured and calculated bicarbonate results can in practice be clinically interchangeable comes in a very recent report from the Mayo Clinic [26]. The authors of this report recovered 17,621 records of measured and calculated bicarbonate concentration for samples collected simultaneously from the same patients during 2006/7. Bicarbonate concentration of this huge database ranged from 5 to 49 mmol/L.
The mean difference (SD) between measured and calculated values was -0.36 (1.23 mmol/L), and for 98.5 % of paired samples results were within 3 mmol/L of each other. Although, as the Mayo report suggests, there is usually acceptable agreement between the two parameters, it is by no means rare for results to be wholly discordant, with measured ctCO2 differing from calculated bicarbonate by as much as 15 mmol/L [7].
Numerous studies over the past forty years have sought to establish the frequency, magnitude and cause of discrepancy between calculated bicarbonate and measured ctCO2.
An early focus of this work questioned the reliability of the bicarbonate calculation, which depends crucially on the constancy of pK/1 (see equation 4). In fact this is not a true thermodynamic constant but an ‘apparent’ dissociation constant determined experimentally from measurement of pH, pCO2 and dissolved CO2 [8] using the following relationship derived from the Henderson-Hasselbach equation:
| pK/1 = pH + log dCO2 - log [HCO3-] [4] |
Several studies [7,9-15] revealed sufficient variability in pK/1, particularly among the critically ill, for clinically significant error in calculated bicarbonate. For example in one study [14] pK/1 was found to range from 5.84 to 6.29.
The authors calculate that deviations from pK/1 6.1 of this magnitude would result in errors in calculated bicarbonate of the order ± 60 %. Another [15] describes the case of a diabetic child in ketoacidosis whose pK/1 ranged from 5.49 to 6.02 over a seven-hour period.
In a study of 79 infants being cared for in a pediatric intensive care unit [13], 25 % were found to have pK/1 outside the ‘normal’ range 6.055-6.195 defined by the study, and in three cases pK/1 was > 6.3, with one ‘astounding’ value of 7.11. These and other reports of clinically significant variability in pK/1 have been disputed [16-20] and the reliability or otherwise of calculated bicarbonate remains an unresolved, contentious issue.
The theoretical basis for the view that calculated bicarbonate is unreliable in critical illness has been set out by Flear [8]. An equally theoretical approach accompanied by a wealth of experimental evidence has been deployed by Mass et al [17] to make the opposing case in defense of calculated bicarbonate.
Authors of studies that have failed to demonstrate clinically significant variability in pK/1 suggest that the major discordance between calculated bicarbonate and measured ctCO2, occasionally seen in clinical practice, is most likely the result of a combination of pre-analytical variables, analytical difference and random analytical error [18].
Measurement of ctCO2 is particularly prone to pre-analytical variability because blood for U&E profiling is universally collected and processed aerobically. Samples can be left uncapped for hours prior to analysis. Since ambient air contains less CO2 than blood, there is a tendency for dissolved CO2 to be lost from the sample. This has been estimated to reduce measured CO2 at the rate of 6 mmol/hr.
By contrast calculated bicarbonate is not associated with the same risk of pre-analytic variation because blood for blood gas analyses are routinely sampled anaerobically, and there is minimal delay (almost invariably < 30 mins) between sampling and analysis.
Another contributory cause of discordance between measured and calculated values might be sample difference, since arterial blood is used to calculate a value and serum or plasma samples are used to measure a value.
Whatever the cause, studies continue to demonstrate moderate but clinically significant discordance between the two parameters among the critically ill [21-23]. However, as if to confirm the contentious nature of the debate, the most recent study of critically ill patients provides evidence of acceptable agreement between calculated bicarbonate and measured ctCO2 [24].
Notwithstanding this last study, there is a body of opinion that for critically ill patients at least, it might be prudent to abandon calculated bicarbonate in favor of measured ctCO2 [13,15], although it must be emphasized that this view is contentious and it could be that the clinical impact of differences is limited.
The evidence of acceptable agreement provided by the very large Mayo Clinic study [26] cannot unfortunately be used in the particular debate that centers on the critically ill, because the patient population was not defined.
Of the two parameters, calculated bicarbonate has the distinct advantage of convenience over measured ctCO2 because it allows all three parameters (pH pCO2 and bicarbonate) used in assessment of acid-base to be available at the same time from a single specimen.
There remains no consensus in the literature on many of the issues discussed above. Thus it even remains unclear if there is or is not discordance between measured and calculated CO2, although the balance of evidence has recently shifted in favor of no discordance by the large Mayo Clinic study [26].
For those who believe that the balance of evidence suggests that there is discordance, there are two further unresolved issues.
These are: the clinical significance of that discordance and the cause of that discordance. Debate about the cause of discordance has focused mainly on whether or not pKl1 varies significantly between patients and the extent to which preanalytical differences, analytical differences and random error contribute to discordance.
Finally at least one commentator [25] has questioned the clinical need for either calculated bicarbonate or measured ctCO2, suggesting that pH and pCO2 alone permit full assessment of acid-base disturbances.
SUMMARY
Carbon dioxide is a product of aerobic cell metabolism that is transported in blood to the lungs for excretion in expired air. A little is transported unchanged dissolved in blood, but most is transported as bicarbonate.
Regulation of the amount of carbon dioxide in blood, or more precisely regulation of the ratio of bicarbonate to dissolved carbon dioxide concentration, is essential for maintenance of blood pH (normal acid-base balance).
Clinical investigation of acid-base disturbance includes arterial blood gas analysis, a test that generates three parameters of carbon dioxide status. Of these just one, pCO2, is actually measured; the other two - plasma bicarbonate and total carbon dioxide concentration - are derived by calculations from measured pH and pCO2.
The validity of these calculations has been questioned and there is conflicting evidence that in some patient groups it might be more clinically reliable to measure total carbon dioxide by chemical methods, than to rely on calculated values.
This last remains a highly contentious issue that can only be finally resolved by further study.
References+ View more
- Lumb A. Carbon dioxide. In: Nunns Applied Respiratory Physiology. 6th ed. Oxford: Butterwoth Heineman, 2005: Chapter 10, 222-48.
- Geers C, Gros G. Carbon dioxide transport and carbonic anhydrase in Blood and muscle. Physiological Reviews 2000; 80(2): 681-15.
- Zilva JF, Pannell PR, Mayne PD. Hydrogen ion homeostasis: blood gas levels In: Clinical Chemistry in Diagnosis and Treatment. 5th ed. London: Edward Arnold, 1988: Chapter 4.
- NCCLS Blood Gas and pH analysis and related measurements: Approved guideline. NCCLS Publication C46-A. USA, Pennsylvania: NCCLS, 2001.
- Davenport H. Quantitation of the metabolic component: standard bicarbonate. In: The ABC of Acid Base Balance. 6th revised ed. Chicago: University of Chicago Press, 1974: 116-118.
- Burnett R, Covington A, Fogh-Anderson N et al. IFCC Reference measurement procedure for substance concentration determination of total carbon dioxide in blood, plasma or serum. Clin Chem Lab 2001; 39(3): 283-89.
- O’Leary TD, Langton S. Calculated bicarbonate or Total carbon dioxide? Clin Chem 1989; 35: 1697-00.
- Flear CTG, Covington AK, Stoddart JC. Bicarbonate or CO2? Arch Int Med 1984; 144: 2285-87.
- Sinclair MJ, Hart RA Pope HM et al The use of the Henderson-Hasselbalch equation in routine medical practice. Clin Chim Acta 1968;19:63-69.
- Trenchard D, Noble M, Guz A. Serum carbonic acid pK/1 abnormalities in patients with acid-base disturbances. Clin Sci 1967; 32: 189-00.
- Natelson S, Nobel D. Effect of variation of pK/1 of Henderson Hasselbach equation on values obtained for total CO2 calculated from pCO2 and pH values. Clin Chem 1977; 23: 767-69.
- Tibi L, Bhattacharya S, Flear C. Variability in pK/1 of human plasma. Clin Chim Acta 1982; 121: 15-31.
- Rosan R, Enlander D, Ellis S. Unpredictable error in calculated bicarbonate homeostasis during pediatric intensive care: the delusion of the fixed pK. Clin Chem 1983; 29: 69-73.
- Flear C, Roberts S et al. pK/1 and bicarbonate concentration in plasma. Clin Chem 1987; 33: 13-20.
- Kost G, Trent J et al. Indications for measurement of total carbon dioxide in arterial blood. Clin Chem 1988; 34: 1650-52.
- Austin WH, Ferrante V, Anderson C. Evaluation of whole blood pK/1 in the acutely ill patient. J Lab Clin Med 1968; 72: 129-35.
- Maas A, Rispens P, Siggard-Anderson O et al. On the reliability of Henderson-Hasselbach equation in routine clinical acid-base chemistry. Ann Clin Biochem 1984; 21: 26-39.
- Ungerer J, Ungerer M, Vermaak W. Discordance between measured and calculated total carbon dioxide. Clin Chem 1990; 36: 2093-96.
- Kruse J, Hukku P, Carlson R. Constancy of blood carbonic acid pK/1 in patients during cardiopulmonary resuscitation. Chest 1988; 93: 1221-24.
- Masters P, Blackburn M et al. Determination of plasma bicarbonate of neonates in Intensive care. Clin Chem 1988; 34: 1483-85.
- Lolekha P, Boonlet W et al. Comparative study of values of calculated bicarbonate and measured total carbon dioxide content. Point of Care 2003; 2(2): 135-43.
- Frezzotti A, Gambini A et al. Total carbon dioxide measured by the Vitros enzymatic method. Clin Chem Lab Med 1998; 36(1): 43-46.
- Story D, Poustie S. Agreement between two plasma bicarbonate assays in critically ill patients. Anaesth Intensive Care 2000; 28(4): 399-02.
- Chittama A, Vanavanan S. Comparative study of calculated and measured total carbon dioxide. Clin Chem Lab Med 2008; 46(1): 15-17.
- Miller A. Plasma bicarbonate assays - time for a new look? Ann Clin Biochem 1993; 30: 233-37.
- Kumar V, Karon B. Comparison of Measured and Calculated Bicarbonate values. Clin Chem 2008;54:1586-7
References
- Lumb A. Carbon dioxide. In: Nunns Applied Respiratory Physiology. 6th ed. Oxford: Butterwoth Heineman, 2005: Chapter 10, 222-48.
- Geers C, Gros G. Carbon dioxide transport and carbonic anhydrase in Blood and muscle. Physiological Reviews 2000; 80(2): 681-15.
- Zilva JF, Pannell PR, Mayne PD. Hydrogen ion homeostasis: blood gas levels In: Clinical Chemistry in Diagnosis and Treatment. 5th ed. London: Edward Arnold, 1988: Chapter 4.
- NCCLS Blood Gas and pH analysis and related measurements: Approved guideline. NCCLS Publication C46-A. USA, Pennsylvania: NCCLS, 2001.
- Davenport H. Quantitation of the metabolic component: standard bicarbonate. In: The ABC of Acid Base Balance. 6th revised ed. Chicago: University of Chicago Press, 1974: 116-118.
- Burnett R, Covington A, Fogh-Anderson N et al. IFCC Reference measurement procedure for substance concentration determination of total carbon dioxide in blood, plasma or serum. Clin Chem Lab 2001; 39(3): 283-89.
- O’Leary TD, Langton S. Calculated bicarbonate or Total carbon dioxide? Clin Chem 1989; 35: 1697-00.
- Flear CTG, Covington AK, Stoddart JC. Bicarbonate or CO2? Arch Int Med 1984; 144: 2285-87.
- Sinclair MJ, Hart RA Pope HM et al The use of the Henderson-Hasselbalch equation in routine medical practice. Clin Chim Acta 1968;19:63-69.
- Trenchard D, Noble M, Guz A. Serum carbonic acid pK/1 abnormalities in patients with acid-base disturbances. Clin Sci 1967; 32: 189-00.
- Natelson S, Nobel D. Effect of variation of pK/1 of Henderson Hasselbach equation on values obtained for total CO2 calculated from pCO2 and pH values. Clin Chem 1977; 23: 767-69.
- Tibi L, Bhattacharya S, Flear C. Variability in pK/1 of human plasma. Clin Chim Acta 1982; 121: 15-31.
- Rosan R, Enlander D, Ellis S. Unpredictable error in calculated bicarbonate homeostasis during pediatric intensive care: the delusion of the fixed pK. Clin Chem 1983; 29: 69-73.
- Flear C, Roberts S et al. pK/1 and bicarbonate concentration in plasma. Clin Chem 1987; 33: 13-20.
- Kost G, Trent J et al. Indications for measurement of total carbon dioxide in arterial blood. Clin Chem 1988; 34: 1650-52.
- Austin WH, Ferrante V, Anderson C. Evaluation of whole blood pK/1 in the acutely ill patient. J Lab Clin Med 1968; 72: 129-35.
- Maas A, Rispens P, Siggard-Anderson O et al. On the reliability of Henderson-Hasselbach equation in routine clinical acid-base chemistry. Ann Clin Biochem 1984; 21: 26-39.
- Ungerer J, Ungerer M, Vermaak W. Discordance between measured and calculated total carbon dioxide. Clin Chem 1990; 36: 2093-96.
- Kruse J, Hukku P, Carlson R. Constancy of blood carbonic acid pK/1 in patients during cardiopulmonary resuscitation. Chest 1988; 93: 1221-24.
- Masters P, Blackburn M et al. Determination of plasma bicarbonate of neonates in Intensive care. Clin Chem 1988; 34: 1483-85.
- Lolekha P, Boonlet W et al. Comparative study of values of calculated bicarbonate and measured total carbon dioxide content. Point of Care 2003; 2(2): 135-43.
- Frezzotti A, Gambini A et al. Total carbon dioxide measured by the Vitros enzymatic method. Clin Chem Lab Med 1998; 36(1): 43-46.
- Story D, Poustie S. Agreement between two plasma bicarbonate assays in critically ill patients. Anaesth Intensive Care 2000; 28(4): 399-02.
- Chittama A, Vanavanan S. Comparative study of calculated and measured total carbon dioxide. Clin Chem Lab Med 2008; 46(1): 15-17.
- Miller A. Plasma bicarbonate assays - time for a new look? Ann Clin Biochem 1993; 30: 233-37.
- Kumar V, Karon B. Comparison of Measured and Calculated Bicarbonate values. Clin Chem 2008;54:1586-7
May contain information that is not supported by performance and intended use claims of Radiometer's products. See also Legal info.


Acute care testing handbook
Get the acute care testing handbook
Your practical guide to critical parameters in acute care testing.
Download now
Related webinar
Evolution of blood gas testing Part 1
Presented by Ellis Jacobs, PhD, Assoc. Professor of Pathology, NYU School of Medicine.
Watch the webinar