Printed from acutecaretesting.org
January 2012
Potential benefits when the critical reference change value for serial measurements of troponin I is used


INTRODUCTION
All clinical biochemistry tests used in the biomedical and diagnostic field are subject to analytical and biological variations.
To interpret the results of clinical biochemistry tests, like cardiac marker tests, sequential values of the concentrations can be used to give useful information about a pathologic state or a risk of sudden cardiac event.
Thus the interpretation of acute care testing requires not only a comparison with threshold value or decision limit, but comparison between consecutive measurements.
Here is shown a simple and reliable method, based on the reference change value (RCV), to assess the significance between two consecutive cTnI results from the same patient.
WHAT IS THE CRITICAL REFERENCE CHANGE VALUE
The RCV and the derived parameter critical reference change value (CrRCV) are tools for the interpretation of the results of two consecutive troponin tests.
The RCV identifies significant changes in the patient’s clinical condition. RCV takes into account the within-subject biological variation as well as the analytical variation (the imprecision).
The CrRCV represents the value that divides all results into regions of significant and non-significant change.
The within-subject biological variation is the natural fluctuation of the concentration of an analyte around the homeostatic setting point.
The imprecision of a specific analyte measured with a specific method is a function of analyte concentration, see Fig. 1.
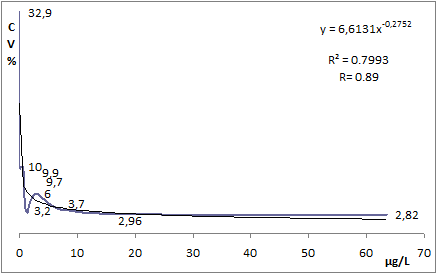
FIG. 1: cTnI imprecision profile and its fitted hyperbolic curve. Equation of the fitted curve allowed the estimation of the cTnI variation ranges. Results obtained on a laboratory analyzer.
The analytical imprecision of the method shown in Fig. 1 can be simplified into three levels: high, intermediate and low. The hyperbolic curve that interpolates the experimental points of the imprecision profile is used for this purpose.
The CV% value used for each level of analytical imprecision is the 75th percentile for the confidence interval.
The three cTnI concentration ranges having high, intermediate and low imprecision, respectively, and the corresponding RCV values are shown in Table I.
TABLE I
|
Range |
TnI conc level |
RCV |
| A |
0.010-0.050 µg/L |
70 % |
| B |
0.060-1.0 µg/L |
45 % |
| C |
1.1-63 µg/L |
28 % |
The different RCV values were calculated using the within-subject biological variation CVwithin, estimated for a sensitive cTnI assay by Wu (2009) [1], and the three levels of analytical imprecision, CVanalytical.
The calculation of the RCV values is based on Harris (1983) [2]:
![]()
An example (range A):
CVanalytical = 23.4 % ~0.234
CVwithin = 9.4 % ~0.094
Z = 1.96 (the z score that corresponds to a 95 % probability that the change is significant)
![]()
Using the RCV values in Table I, the CrRCV can be calculated for any cTnI value measured with this assay.
When a patient presents with chest pain, he/she has to be evaluated with serial troponin measurements. The result of the second sample should be compared to the CrRCV.
This approach allows an immediate evaluation of the significance of any difference between values of serial samples for cTnI. Only if the result of the second samples is higher than the CrRCV, the change can be considered statistically significant.
PRACTICAL EXAMPLES OF CrRCV FOR CLINICAL DECISION MAKING
Scientific and technological tools can be useful if they are easily applicable to real life. This is the case for a CrRCV used for the interpretation of two consecutive cTnI values.
A patient who arrives at an emergency department (ED) or doctor's office with symptoms indicating an acute coronary syndrome (ACS) has biochemical tests such as the plasma cTnI performed.
The first value may or may not exceed the decision limit (with this method it is 0.050 µg/L) but in the absence of definitive clinical and electrocardiographic signs, only cTnI consecutive determinations can identify myocardial injury.
So what are the potential benefits of the CrRCV for clinical decision making in this situation? The CrRCV will with a high probability indicate whether a cTnI concentration of the second sample, which is higher than the value of the first sample, represents an increased cardiac cell damage with release of cTnI into the circulation.
Given our specific analytical system and its imprecision, we can calculate CrRCV as follows:
Range A
CrRCV = first cTnI value + (first cTnI value × 0.70)
Example:
The patient’s first value at the admission is 0.040 µg/L; after 4-6 hours the second cTnI value is 0.060 µg/L.
CrRCV = 0.040 µg/L + (0.040 µg/L × 0.70) = 0.068 µg/L.
The increase in cTnI concentration from the first till the second sample should be interpreted as not statistically significant as 0.060 µg/L < 0.068 µg/L.
Range B
CrRCV = first cTnI value + (first cTnI value × 0.45)
Example:
The patient’s first value at the admission is 0.060 µg/L; after 4-6 hours the second cTnI value is 0.10 µg/L.
CrRCV = 0.060 µg/L + (0.060 µg/L × 0.45) = 0.087 µg/L.
The increase in cTnI concentration from the first till the second sample should be interpreted as statistically significant as 0.10 µg/L > 0.087 µg/L.
Range C
CrRCV = first cTnI value + (first cTnI value × 0.28)
Example:
The patient’s first value at the admission is 1.5 µg/L; after 4-6 hours the second cTnI value is 1.8 µg/L.
CrRCV = 1.5 µg/L + (1.5 µg/L × 0.28) = 1.9 µg/L.
The increase in cTnI concentration from the first till the second sample should be interpreted as statistically not significant as 1.8 µg/L < 1.9 µg/L.
CONCLUSIONS
In clinical practice the diagnostic accuracy of laboratory tests is becoming increasingly important. The interpretation of diagnostic results is a challenge for the clinician as well as for the laboratory scientist.
For this reason, methods that increase the knowledge of the obtained data must be implemented. The CrRCV is a simple and immediate way to support the interpretation of two consecutive measurements.
In this paper, the value of using CrRCV to evaluate short-term changes in cTnI concentrations has been shown. The CrRCV is closely linked to the imprecision of the assay used for troponin I measurement.
CrRCV may become a dynamic tool of the laboratory and clinical interpretation. This new RCV-derived parameter should be assessed in studies before it is implemented.
When implemented, CrRCV will be of help, especially for the younger and less experienced physicians who, in a busy environment as the emergency room, have to make the correct diagnosis as soon as possible to ensure the right treatment of the patient.
References
- Wu AH. Interpretation of high sensitivity cardiac troponin I results: reference to biological variability in patients who present to the emergency room with chest pain: case report series. Clin Chim Acta 2009; 401(1-2): 170-74
- Harris EK, Yasaka T. On the calculation of “reference change” for comparing two consecutive measurements. Clin Chem 1983; 29(1): 25-30
May contain information that is not supported by performance and intended use claims of Radiometer's products. See also Legal info.


Acute care testing handbook
Get the acute care testing handbook
Your practical guide to critical parameters in acute care testing.
Download now
Related webinar
Value of Point of Care Troponin Testing in Assessing Acute Coronary Syndrome
Presented by A/Prof Louise Cullen MBBS(Hon) FACEM, Senior Staff Specialist, Department of Emergency Medicine Watch the webinar
Scientific webinars
Check out the list of webinars
Radiometer and acutecaretesting.org present free educational webinars on topics surrounding acute care testing presented by international experts.
Go to webinars