Printed from acutecaretesting.org
June 2001
Quality planning and control strategies
INTRODUCTION
Quality planning and control in a laboratory must begin with analytical quality – the essential quality characteristic of any laboratory test.
It is not the only quality characteristic, but unless analytical quality can be achieved, none of the other characteristics will matter.
For example, fast turnaround time is certainly an important quality characteristic and a driving force for point-of-care testing applications. But, it does not matter how fast the test result is reported if the test result is wrong.
The laboratory must first be able to produce a correct test result before any other quality characteristic matters.
A detailed step-by-step planning process is needed to properly consider the critical factors that affect the quality of laboratory test results.
Analytical quality is a particularly complex characteristic, involving the imprecision, inaccuracy, and instability of a measurement procedure, as well as the error detection and false rejection characteristics of a statistical QC procedure.
QUALITY REQUIREMENTS
The starting point for quality design must be the definition of the tolerance limits or quality requirement for the testing process.
A debate over the best type of quality requirement has been going on for the last twenty years and has unfortunately overshadowed the use and application of quality requirements.
Finally, in 1999 at an international conference in Stockholm, a consensus was achieved on a system of quality standards [1].
This system includes different sources of information and different formats for requirements, such as the allowable total error (analytical outcome criterion), the clinical decision interval (clinical outcome criterion), or the maximum allowable standard deviation and the maximum allowable bias (analytical performance criteria).
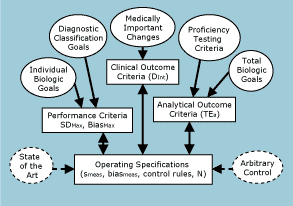 |
FIG. 1: A system of quality standards. |
Fig. 1 shows my view of the relationships between these different sources of information, different types of quality requirements, and the operating specifications needed for managing routine testing processes [2].
Starting at the top of the figure, medically important changes in test results can be defined by standard treatment guidelines (clinical pathways, clinical practice guidelines, etc.) to establish clinical outcome criteria (or decision intervals, Dint).
Such clinical criteria can be converted to laboratory operating specifications for imprecision (smeas), inaccuracy (biasmeas), and QC (control rules, N) by a clinical quality-planning model [3] that takes into account preanalytical factors, such as individual or within-subject biological variation (swsub).
The left side of the figure shows how performance criteria for imprecision and inaccuracy can be defined as separate analytical goals for the maximum imprecision and bias that would be allowable for the stable performance of the method.
Specifications for maximum imprecision and bias can be derived on the basis of within-subject biological variation [4].
The maximum allowable bias can also be derived from diagnostic classification models [5].
Laboratories can utilize these separate performance criteria by relating observed method performance to the maximum allowable value, calculating the critical-size error that needs to be detected to maintain satisfactory performance, and then selecting appropriate QC procedures by use of power function graphs.
The right side of Fig. 1 shows how proficiency testing criteria define analytical outcome criteria in the form of allowable total errors (TEa), which can be translated into operating specifications (smeas, biasmeas, control rules, N) using an analytical quality-planning model [6].
Note that the allowable total error can also be set on the basis of total biological goals that are based on population variation or individual variation [7], therefore an extensive data bank of individual biological variation is available for use in calculating an allowable biological total error [8].
The bottom line in this system are operating specifications.
Both clinical and analytical quality requirements, i.e., decision intervals and allowable total errors, respectively, can be translated into the practical specifications that are needed to manage routine operations.
These operating specifications consist of the imprecision and inaccuracy that are allowable for the method, and the control rules and number of control measurements that are necessary to monitor and assure the quality of the testing process.
These exact values for the CV, bias, control rules, and N are interdependent, permitting many different combinations that will still assure that the desired quality will be achieved.
The many possible combinations can be shown graphically by OPSpecs charts to help analysts and managers determine how to properly manage the analytical quality of a testing process.
Thus, all these different forms of quality standards have some use in the context of a system for analytical quality management.
However, until this system is recognized, understood, and applied, the different re-commendations in the literature will continue to be incoherent, rather than useful and practical for analytical quality management.
ANALYTICAL QUALITY REQUIREMENTS
A statement of an allowable total error most closely represents the industrial tolerance limits for a production process. It considers both inaccuracy (the centering of the process on a target value) and imprecision (the distribution of individual products around that target).The most common sources of these types of requirements are the proficiency testing or external quality assessment programs that specify acceptability limits in the form of a target value plus/minus certain tolerances.
In the US, CLIA defines such limits for approximately 80 different tests [9]. In other countries, such as Australia and Canada, the lists and criteria may be even more extensive.
These PT limits define minimum levels of quality that must be achieved; therefore, it is always important to plan testing processes that will assure that PT criteria are achieved in routine operation.
This can be accomplished by using an analytical quality-planning model that translates these requirements into the imprecision and inaccuracy that are allowable, and the QC that is necessary [6].
Total error requirements can also be calculated from biological goals, in the manner recommended by Petersen et al [7] and presented by Ricos [8] in a listing for over 300 quantities.
CLINICAL QUALITY REQUIREMENTS
Practical information can be provided in the form of a medically important change, medically significant change, or clinical decision limit, which are the commonly used terms for this type of quality requirement.
One major advantage of this type of quality requirement is that information is directly available from the customers, either through their description of how they use and interpret a laboratory test, through clinical pathways that detail the expected use and interpretation of tests, or through audits of clinical practices.
When this information is properly translated into operating specification via a quality-planning model that accounts for preanalytical factors, it provides a useful and valid approach for defining and managing the quality of the testing process.
One early source of information about medically important changes in test values is a paper by Skendzel, Barnett, and Platt [10].
This paper is sometimes criticized for the rather large values recommended for medically useful CVs (Table 2 of original paper) and derived at without accounting for within-subject biological variation.
When Fraser’s figures for within-subject biological variation [11,12] are used in a clinical quality-planning model that accounts for biological variation, the allowable CVs are much smaller [13].
The original recommendations for allowable CVs were limited by an over-simplified quality-planning model that attributed the total variation to analytical variation, rather than first deducting the known biological variation.
QUALITY PLANNING AND CONTROL APPLICATIONS
The main applications involve either (a) the selection of the method of analysis or establishment of performance specifications for imprecision and inaccuracy, or (b) the selection of a QC procedure for a method in routine service.
In both cases, the first step will be to define the quality requirement for the diagnostic test of interest.
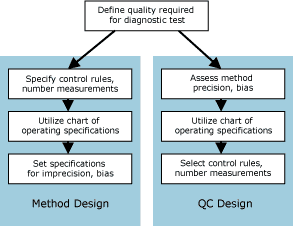 |
FIG. 2: Quality-planning strategies for method design and QC design. |
Then, as shown in Fig. 2, there are two variations of the planning process, depending on whether the purpose is to select the method of analysis or to select a QC procedure:
- To select a method of analysis or set performance specifications for a method, the quality-planning process involves specifying the QC procedure (statistical control rules, number of control measurements, or N) that will be employed, and then setting the developmental or purchase specifications for the imprecision and inaccuracy of the method.
- To select a QC procedure for a method, the process involves assessing method performance (imprecision and inaccuracy), and then selecting the statistical control rules and number of control measurements to be used.
The key step in both applications is the use of an appropriate quality-planning tool that will translate the defined quality requirement into specifications for the imprecision and inaccuracy that are allowable and the QC that is necessary.
A chart of operating specifications (or OPSpecs chart) is the most practical tool because it provides all of the necessary information on a single graph [14]. It is easy to use and easy to prepare using a computer program, but it is complicated to understand.
An analytical quality-planning model is available to translate an allowable total error requirement into the imprecision and inaccuracy that are allowable and the QC that is necessary [6].
A clinical model is available that accounts for preanalytical factors, such as within-subject biological variation, as well as the analytical factors – imprecision, inaccuracy, and QC [3].
STEP-BY-STEP QC PLANNING PROCESS
To develop a more detailed process for planning QC procedures, the NCCLS guidelines for statistical QC applications [15] provide a good starting point.
In devising a step-by-step planning process here, QC performance will be characterized by the probabilities of rejecting runs having different sizes of errors; therefore there are two probabilities that are of particular interest:
- Probability of false rejection, i.e., the chance of rejecting a run when there are no errors except for the inherent random error of the method;
- Probability for error detection, i.e., the probability or chance of rejecting a run whether there is an error present in addition to the inherent random error of the method.
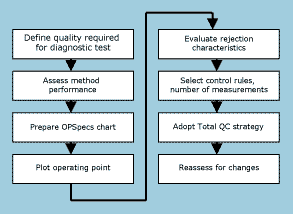 |
FIG. 3: A step-by-step QC planning process. |
An eight-step quality-planning process is shown in the flowchart of Fig. 3. Here is a description of each of the steps:
- Define the quality required for the test. For practical purposes, it is easiest to get started with requirements in the form of an allowable total error, such as specified by proficiency testing or external quality assessment programs.
- Assess method performance in terms of imprecision and inaccuracy. Here is where method validation experiments are important to provide the initial estimates of imprecision (from a replication experiment) and inaccuracy or bias (from a comparison of methods experiment). Later on, the estimates of imprecision can be obtained from routine QC data and estimates of bias can be obtained from monthly peer comparison data and proficiency testing results.
- Assess QC performance of candidate procedures in terms of the rejection characteristics or power curves. This information is available in the scientific literature for most of the commonly used QC procedures [16] and can be incorporated in quality-planning tools and technology to facilitate the application.
- Utilize QC planning tools. The available tools include power function graphs [16], critical-error graphs [17], and OPSpecs charts [18]. The OPSpecs chart is recommended here because it is a quantitative tool that is easy to use and readily available.
- Evaluate the probabilities of rejection for the operating conditions in the laboratory. In the quality-planning process recommended here, the probabilities for false rejection will be minimized (below 0.05 or 5 %) and error detection will be maximized (0.90 or 90 % and greater).
- Select appropriate control rules and the total number of control measurements. A wide variety of control rules are available. The rejection characteristics of each QC procedure must be known if it is to be a candidate for implementation. Candidate QC procedures include single-rules such as 12s, 12.5s, 13s, and 13.5s with Ns of 2, 3, 4, and 6; multi-rules such as 13s/22s/R4s/41s/8 x with Ns of 2 and 4, and 13s/2of32s/R4s/31s/6 x with Ns of 3 and 6.
- Adopt a Total QC strategy that provides an appropriate balance of statistical and non-statistical components. This TQC strategy defines the relative amount of effort expended for statistical QC, instrument function checks, method validation tests, patient data QC, preventive maintenance, and operator training.
- Reassess the control rules, N, and TQC strategy when method performance or quality requirements change. Given a quality-planning process that is quick and easy to perform, it can be repeated whenever changes occur or when methods are periodically reviewed.
TOOLS AND TECHNOLOGY
A laboratory’s ability to do anything efficiently often depends on utilizing tools and technology to facilitate a process.
Most laboratory procedures have evolved from an initial qualitative manual method (1st generation) that has then been systematized and made more quantitative with tools such as diluters and photometers, then automated through succeeding generations of technology until complete systems are available that are highly efficient and productive (such as today’s 4th- and 5th-generation chemistry and hematology analyzers).
Quality planning, likewise, must evolve from a qualitative manual method to a systematic process that utilizes standard tools to a quantitative automated process that is quick and effective.
Concerning OPSpecs charts – the quality-planning tool recommended here – different “generations” are available, as follows:
- “Manual from scratch” using theoretical models available in the scientific literature with implementation via electronic spreadsheets [3,6];
- “Kit form” using preprinted charts in workbook form (an atlas of maps), such as the OPSpecs Manual [19], or using a standard set of “normalized” OPSpecs charts [20];
- “Semi-automated” using Internet calculation tools, such as
the “normalized” OPSpecs calculator; [see http://www.westgard.com/
normcalc.htm] - “Automated” using a PC computer program – QC Validator 2.0 or EZ Rules – that prepares OPSpecs charts for both analytical total error requirements and clinical decision interval requirements and fully automates the selection of QC procedures [21-23, see http://www.westgard.com/essay31.htm];
- “Highly automated” using a “QC rule selection engine” that can be embedded in QC software, such as the EZ Runs program, to support the automatic selection and design of QC procedures [see http//www.westgard.com/ezrunspreview.htm].
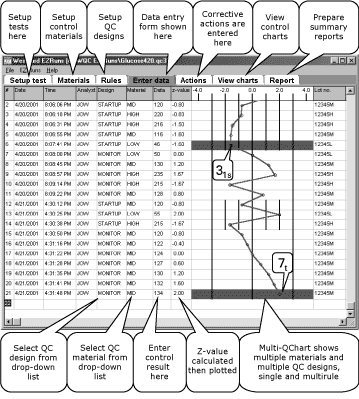
FIG. 4: EZ Runs QC Program with automatic design
for multi-stage QC procedures. This example shows two QC designs:
STARTUP QC
13s/2of32s/R4s/31s with
N=3, R=1 and MONITOR QC 13s/7t/7x with N=1, R=7.
An example of the implementation of automated multi-stage QC designs via a QC program on a personal computer is shown in Fig. 4.
This figure is a screen capture from the EZ Runs computer program
that has been developed to demonstrate the capabilities needed to
implement multi-control, multi-stage, multi-rule QC designs using a
single data entry form that provides immediate charting and
real-time flagging of out-of-control conditions.
The implementation of two different QC designs is evident from the
control limits that have been drawn on the control chart.
Note that the control chart is presented as a vertical display, rather than the usual horizontal display. Turn the journal sideways and the control chart will look more familiar.
The data fields for date and time are automatically filled in by the program. The analyst ID is entered, the QC design selected, and the control material selected, and the control result entered.
The program then calculates a z-value that is plotted immediately on the control chart and flagged if any control rules are violated.
A flag shows as a red horizontal bar on the QC chart. For example, entry #6 has been flagged because of a 31s-rule violation (3 consecutive control measurements are high by at least 1s); entry #21 has been flagged because of a 7t-rule violation (7 consecutive control measurements are trending upward).
SAGE ADVICE
Future improvements in analytical quality management will almost certainly depend on improvements in measurement systems and QC technology [24]:- Forget about government clearance of manufacturer’s QC instructions
- Use quality goals to guide method validation and QC design;
- Implement multi-stage QC procedures;
- Implement patient-data QC to complement reference-sample QC;
- Focus on detection of systematic errors; and
- Apply the quality system approach to monitor the total testing process.
These strategies should lead to the next generation of QC
procedures and a more cost-effective approach to managing the
quality of laboratory tests.
The need for multi-stage or multiple QC designs almost certainly
requires improved QC technology. The fundamental structure of
a QC procedure should allow for 3 different QC designs:
- Startup design for high error detection;
- Monitor design for low false rejections;
- Patient data design for measuring stability or run length.
The need for multi-stage QC can be documented for almost any multi-test analyzer by determining the process capability for each of the tests on a scale from 1 to 6 sigma, where the number of sigmas is calculated from the tolerance limits minus the bias divided by the standard deviation [sigma metric = (TEa - bias)/s].
A recent assessment from published data showed methods with process capabilities from 2 sigma to over 6 sigma [25].
Given that 6-sigma performance represents World Class Quality and that 3-sigma performance is the minimum that is acceptable for routine production, laboratories have little choice but to design their QC procedures to properly complement the performance observed for their analytical methods.
The ability of laboratories to do so will depend on having better QC software available in instruments, data workstations, and laboratory information systems.
Ultimately, laboratories need a totally automated QC process that provides automatic QC design, automatic collection and interpretation of QC data, automatic release of validated test results, identification and documentation of problems, support for troubleshooting and corrective actions, on-going data review and peer comparisons, and automatic adaptation or re-design when there are changes in method performance.
References+ View more
- Petersen PH, Fraser CG, Kallner A, Kenny D. Strategies to set global analytical quality specifications in laboratory medicine. Scand J Clin Lab Invest 1999; 59, 7: 477-78.
- Westgard JO. The need for a system of quality standards for modern quality management. Scand J Clin Lab Invest 1999; 59: 483-86.
- Westgard JO, Hyltoft Petersen P, Wiebe DA. Laboratory process specifications for assuring quality in the U.S. National Cholesterol Education Program. Clin Chem 1991; 37: 656-61.
- Fraser CG, Hyltoft Petersen P, Ricos C, Haekel R. Proposed quality specifications for the imprecision and inaccuracy of analytical systems for clinical chemistry. Eur J Clin Chem Clin Biochem 1992; 30: 311-17.
- Klee GG. Tolerance limits for short-term analytical bias and analytical imprecision derived from clinical assay specificity. Clin Chem 1993; 39: 1514-18.
- Westgard JO, Wiebe DA. Cholesterol operational process specifications for assuring the quality required by CLIA proficiency testing. Clin Chem 1991; 37: 1938-44.
- Hyltoft Petersen P, Ricos C, Stockl D, Libeer JC, Baadenhuijsen H, Fraser C, Thienpont L. Proposed guidelines for the internal quality control of analytical results in the medical laboratory. Eur J Clin Chem Clin Biochem 1996; 34: 983-99.
- Ricos C, Alvarez V, Cava F, Garcia-Lario JV, Hernandez A, Jimenez CV, Minchinela J, Perich C, Simon M. Current databases on biological variation: pros, cons and progress. Scand J Clin Lab Invest 1999; 59: 491-500.
- U.S. Department of Health and Human Services. Medicare, Medicaid and CLIA programs; Regulations implementing the Clinical Laboratory Improvement Amendments of 1988 (CLIA). Final rule. Fed Regist 1992; 57: 7002-186.
- Skendzel LP, Barnett RN, Platt R. Medically useful criteria for analytic performance of laboratory tests. Am J Clin Pathol 1985; 83: 200-05.
- Fraser CG. Biological variation in clinical chemistry. An update: collated data, 1988-1991. Arch Pathol Lab Med 1992; 116: 916-23.
- Fraser CG. The application of theoretical goals based on biological variation data in clinical chemistry. Arch Pathol Lab Med 1988; 112: 404-15.
- Westgard JO, Seehafer JJ, Barry PL. Allowable imprecision for laboratory tests based on clinical and analytical test outcome criteria. Clin Chem 1994; 40: 1909-14.
- Westgard JO. Charts of operating specifications (OPSpecs charts) for assessing the precision, accuracy, and quality control needed to satisfy proficiency testing criteria. Clin Chem 1992; 38: 1226-33.
- C24-A2. Statistical quality control for quantitative measurements: Principles and definitions; Approved guideline – Second edition. Wayne, PA: National Committee for Clinical Laboratory Standards, 1999.
- Westgard JO, Groth T. Power functions for statistical quality control rules. Clin Chem 1979; 25: 863-69.
- Koch DD, Oryall JJ, Quam EF, Feldbruegge DH, Dowd DE, Barry PL, Westgard JO. Selection of medically useful QC procedures for individual tests on a multi-test analytical system. Clin Chem 1990; 36: 230-33.
- Mugan K, Carlson IH, Westgard JO. Planning QC procedures for immunoassays. J Clin Immunoassay 1994; 17: 216-22.
- Westgard JO. OPSpecs manual – Expanded edition. Madison, WI: Westgard QC, Inc., 1996.
- Westgard JO. Basic planning for quality. Madison WI: Westgard QC, Inc., 2000.
- Westgard JO, Stein B, Westgard SA, Kennedy R. QC Validator 2.0: a computer program for automatic selection of statistical QC procedures for applications in healthcare laboratories. Computer Method Programs Biomed 1997; 53: 175-86.
- Westgard JO, Stein B. Automated selection of statistical quality-control procedures to assure meeting clinical or analytical quality requirements. Clin Chem 1997; 43: 400-03.
- Westgard JO. IT for automating the QC process. Blood Gas News 2001; 9: 13-17.
- Westgard JO. Sage advice about new approaches to quality control. http://www.westgard.com/essay30.htm.
- Westgard JO. Six sigma quality design and control. Madison WI: Westgard QC, Inc., 2001, Chapter 12.
References
- Petersen PH, Fraser CG, Kallner A, Kenny D. Strategies to set global analytical quality specifications in laboratory medicine. Scand J Clin Lab Invest 1999; 59, 7: 477-78.
- Westgard JO. The need for a system of quality standards for modern quality management. Scand J Clin Lab Invest 1999; 59: 483-86.
- Westgard JO, Hyltoft Petersen P, Wiebe DA. Laboratory process specifications for assuring quality in the U.S. National Cholesterol Education Program. Clin Chem 1991; 37: 656-61.
- Fraser CG, Hyltoft Petersen P, Ricos C, Haekel R. Proposed quality specifications for the imprecision and inaccuracy of analytical systems for clinical chemistry. Eur J Clin Chem Clin Biochem 1992; 30: 311-17.
- Klee GG. Tolerance limits for short-term analytical bias and analytical imprecision derived from clinical assay specificity. Clin Chem 1993; 39: 1514-18.
- Westgard JO, Wiebe DA. Cholesterol operational process specifications for assuring the quality required by CLIA proficiency testing. Clin Chem 1991; 37: 1938-44.
- Hyltoft Petersen P, Ricos C, Stockl D, Libeer JC, Baadenhuijsen H, Fraser C, Thienpont L. Proposed guidelines for the internal quality control of analytical results in the medical laboratory. Eur J Clin Chem Clin Biochem 1996; 34: 983-99.
- Ricos C, Alvarez V, Cava F, Garcia-Lario JV, Hernandez A, Jimenez CV, Minchinela J, Perich C, Simon M. Current databases on biological variation: pros, cons and progress. Scand J Clin Lab Invest 1999; 59: 491-500.
- U.S. Department of Health and Human Services. Medicare, Medicaid and CLIA programs; Regulations implementing the Clinical Laboratory Improvement Amendments of 1988 (CLIA). Final rule. Fed Regist 1992; 57: 7002-186.
- Skendzel LP, Barnett RN, Platt R. Medically useful criteria for analytic performance of laboratory tests. Am J Clin Pathol 1985; 83: 200-05.
- Fraser CG. Biological variation in clinical chemistry. An update: collated data, 1988-1991. Arch Pathol Lab Med 1992; 116: 916-23.
- Fraser CG. The application of theoretical goals based on biological variation data in clinical chemistry. Arch Pathol Lab Med 1988; 112: 404-15.
- Westgard JO, Seehafer JJ, Barry PL. Allowable imprecision for laboratory tests based on clinical and analytical test outcome criteria. Clin Chem 1994; 40: 1909-14.
- Westgard JO. Charts of operating specifications (OPSpecs charts) for assessing the precision, accuracy, and quality control needed to satisfy proficiency testing criteria. Clin Chem 1992; 38: 1226-33.
- C24-A2. Statistical quality control for quantitative measurements: Principles and definitions; Approved guideline – Second edition. Wayne, PA: National Committee for Clinical Laboratory Standards, 1999.
- Westgard JO, Groth T. Power functions for statistical quality control rules. Clin Chem 1979; 25: 863-69.
- Koch DD, Oryall JJ, Quam EF, Feldbruegge DH, Dowd DE, Barry PL, Westgard JO. Selection of medically useful QC procedures for individual tests on a multi-test analytical system. Clin Chem 1990; 36: 230-33.
- Mugan K, Carlson IH, Westgard JO. Planning QC procedures for immunoassays. J Clin Immunoassay 1994; 17: 216-22.
- Westgard JO. OPSpecs manual – Expanded edition. Madison, WI: Westgard QC, Inc., 1996.
- Westgard JO. Basic planning for quality. Madison WI: Westgard QC, Inc., 2000.
- Westgard JO, Stein B, Westgard SA, Kennedy R. QC Validator 2.0: a computer program for automatic selection of statistical QC procedures for applications in healthcare laboratories. Computer Method Programs Biomed 1997; 53: 175-86.
- Westgard JO, Stein B. Automated selection of statistical quality-control procedures to assure meeting clinical or analytical quality requirements. Clin Chem 1997; 43: 400-03.
- Westgard JO. IT for automating the QC process. Blood Gas News 2001; 9: 13-17.
- Westgard JO. Sage advice about new approaches to quality control. http://www.westgard.com/essay30.htm.
- Westgard JO. Six sigma quality design and control. Madison WI: Westgard QC, Inc., 2001, Chapter 12.
May contain information that is not supported by performance and intended use claims of Radiometer's products. See also Legal info.
Acute care testing handbook
Get the acute care testing handbook
Your practical guide to critical parameters in acute care testing.
Download nowScientific webinars
Check out the list of webinars
Radiometer and acutecaretesting.org present free educational webinars on topics surrounding acute care testing presented by international experts.
Go to webinars


