Printed from acutecaretesting.org
March 2015
Spurious sodium results (1) – pseudohyponatremia


EPIDEMIOLOGY OF HYPONATREMIA/HYPERNATREMIA
Plasma sodium concentration is normally maintained within the approximate reference range of 135-145 mmol/L so that hyponatremia (reduced plasma sodium) is diagnosed if the result is <135 mmol/L, whilst hypernatremia (increased plasma sodium) is diagnosed if the result is >145mmol/L.
Approximate ranges for mild, moderate and severe hyponatremia are respectively: 130-135 mmol/L; 125-130 mmol/L; and <125mmol/L. Hypernatremia can likewise be usefully categorized as mild (145-150 mmol/L), moderate (151-155 mmol/L) or severe (>155 mmol/L).
Hyponatremia is the most common electrolyte disorder occurring in an estimated 15-30 % of in-hospital patients, according to one review [2]. A recent study [3] found that 10 % of patients presenting at the emergency department of a tertiary care hospital were hyponatremic.
Another [4] found that a remarkable 40 % of 469 consecutive acute medical-admission patients were hyponatremic; mild, moderate and severe hyponatremia being present in 25 %, 11 % and 3 % of this study cohort, respectively.
Hypernatremia is less common, affecting around 1 % of the general hospital population and 10-26 % of those in intensive care [5, 6]. Whilst most studies find hypernatremia to be less common than hyponatremia, that was not so for a large study of more than 8000 critically ill patients examining ICU-acquired sodium disturbance [7].
This revealed that the percentage of patients who developed hypernatremia after admission to intensive care (26 %) exceeded the percentage that developed hyponatremia (11 %).
CLINICAL SIGNIFICANCE OF HYPONATREMIA/HYPERNATREMIA
Mild hyponatremia is usually asymptomatic and the principal clinical concern of hyponatremia is the encephalopathy associated with acute-onset severe hyponatremia and consequent cerebral edema.
This is a medical emergency that initially causes non-specific symptoms such as headache, lethargy and nausea, but can, if left untreated, progress to seizures, coma and ultimately death [8].
Chronic mild-to-moderate hyponatremia is associated with impaired attention and increased risk of falls, osteoporosis and bone fracture [5]. Too rapid correction of hyponatremia can cause specific brain damage (osmotic demyelination) that itself is potentially lethal.
There is an ever-growing body of evidence that hyponatremia even without accompanying encephalopathy is associated with long-term mortality for many patients groups (e.g. those in intensive care, those with heart failure, cirrhosis, and pulmonary embolus, etc.) so that even mild asymptomatic hyponatremia might be clinically significant for many patient groups.
It remains unclear if the observed general association between hyponatremia and mortality means that hyponatremia has a causative role in the eventual death of patients or is merely a surrogate marker of other lethal risk factors associated with the underlying serious condition. This important unresolved aspect of hyponatremia is the subject of a recent review [9].
Mild hypernatremia is usually asymptomatic but severe hypernatremia, like severe hyponatremia, has effect on the central nervous system and results in non-specific symptoms of encephalopathy (e.g. lethargy, nausea, weakness, confusion, headache).
Affected patients may, depending on the cause of the hypernatremia, complain of extreme thirst and have clinical signs of dehydration. In the absence of treatment, severe hypernatremia may progress to seizures, coma and ultimately death. Thus, severe hypernatremia, like severe hyponatremia, is a medical emergency.
MEASURING PLASMA SODIUM CONCENTRATION
For over 80 years plasma sodium concentration has been routinely measured using either one of two broad techniques:
- Flame emission spectrophotometry (FES)
- Potentiometrically by ion-specific electrode (ISE)
Prior to the 1970s when ion-specific electrodes were first developed for use in clinical laboratories, FES was the only method available. The technique [10] depends on the very visible principle that when sodium is burnt in a flame, it emits yellow light of a characteristic wavelength, the intensity of which is proportional to the number of sodium ions.
The method involves aspiration of diluted plasma as a fine spray into a controlled flame of stable form and temperature. The intensity of light emitted by the flame at a particular wavelength (539 nm) characteristic of sodium emission, is measured.
By comparing this intensity measurement with that produced from standard sodium solutions of known concentration, the concentration of sodium in the plasma sample can be computed.
Potentiometric measurement depends on the potential difference (measured in millivolts) that is generated between a reference and measuring electrode when exposed to ions in solution.
With the use of electrode membranes that allow selective passage of a single ionic species, an ion-specific electrode measures the activity of a specific ion (e.g. sodium (Na+), potassium (K+), calcium (Ca2+), chloride (Cl-), etc.) in solution (e.g. the aqueous phase of blood plasma).
Since the 1970s ISE methods have gradually replaced FES methods [11] and nowadays plasma sodium is measured almost exclusively by ISE.
ISE methods are classified as either ”indirect” or ”direct” [11]. The essential difference between the two is in the sample preparation.
The ”indirect” ISE method involves presentation of a prediluted plasma sample to the electrode for measurement (analogous to the predilution step used in FES), whereas the ”direct” ISE method avoid the necessity of a predilution step; the sample (either whole blood, plasma or serum) is presented directly to the electrode.
The ”indirect” ISE method was the first to be developed and shown in many studies to correlate well without bias with the FES method it replaced [11]. It continues to be employed in modern high-throughput chemical analyzers sited in clinical laboratories, principally because predilution allows very low sample volume, a major consideration if sodium is just one of many analytes to be measured.
A small minority of these chemical analyzers employs a ”direct” ISE method, but the vast majority of sodium reports generated in the central hospital laboratory are derived using ”indirect” ISE methodologies.
By contrast, sodium reports generated at the point of care in intensive care units, emergency rooms, operating recovery rooms, etc. using dedicated point-of-care analyzers (including blood gas analyzers) are derived almost exclusively using ”direct” ISE methodologies.
A singular advantage of ”direct” ISE methodology for point-of-care testing is that whole blood can be used, so that the separation of plasma by centrifugation is not necessary.
Another advantage, of greater significance for this discussion, is that ”direct” ISE methods are unaffected by the presence of abnormal amounts of lipid or protein in the sample, whereas both ”indirect” ISE and FES methods are affected [12].
SIGNIFICANCE OF ABNORMAL PROTEIN AND LIPIDS FOR SODIUM MEASUREMENT
An understanding of the effect that abnormal plasma protein and lipid concentration has on sodium measurement depends on recognizing the following:
- Blood plasma/serum is composed of water (normally ~93 % of its volume) and non-aqueous ”solids” (normally ~7 % of its volume) [13] (Fig. 1a).
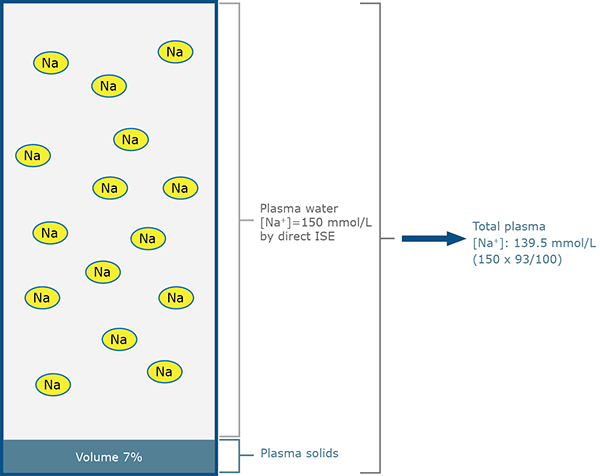
FIG. 1a: Direct ISE measurement for patient A
(normal sodium status – normal protein and lipid)
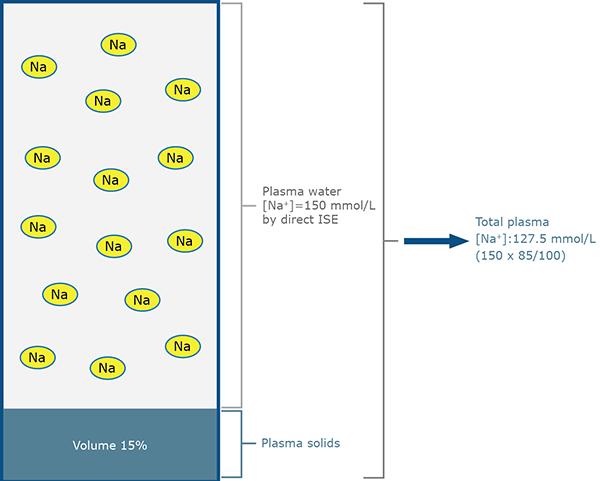
FIG. 1b: Direct ISE measurement for patient B
(normal sodium status – increased lipid)
- Lipids and proteins account for most of the ”solids” in blood plasma/serum and any change in their concentration will affect % volume that solids occupy and thereby % volume that water occupies. The % water volume of plasma/serum is related to lipid and protein concentration by the following equation:
% water volume = 99.1 – 0.73 protein (g/dL) – 1.03 lipid (g/dL) [13]
- All of the sodium in blood plasma/serum is present in the water rather than the ”solid” phase (Fig. 1a).
- In health sodium concentration of plasma/serum water is ~150 mmol/L. When the volume of solids (normally ~7 %) is taken into account, the sodium concentration of total plasma/serum is ~140 mmol/L (150 × 93 / 100).
- ISE measures sodium activity (which approximates to concentration) in plasma/serum water [11] and this measured value is reported as total plasma concentration. The algorithm used to convert measured plasma water concentration to reported total plasma concentration assumes that water constitutes 93 % of total plasma volume (Fig. 1a).
- Although abnormal lipid and/or protein concentration alters the water content of plasma/serum, it does not alter the physiologically important sodium plasma water concentration, which is the parameter measured by ISE. Thus direct ISE sodium measurements, in which samples are presented undiluted to the electrode, are unaffected by change in lipid or protein concentration (Figs. 1a and 1b).
- It is the process of sample predilution used in ”indirect” ISE (and FES) methodology that is responsible for the spurious sodium results associated with abnormal protein and lipid concentration [14, 15] (Figs. 2a and 2b).
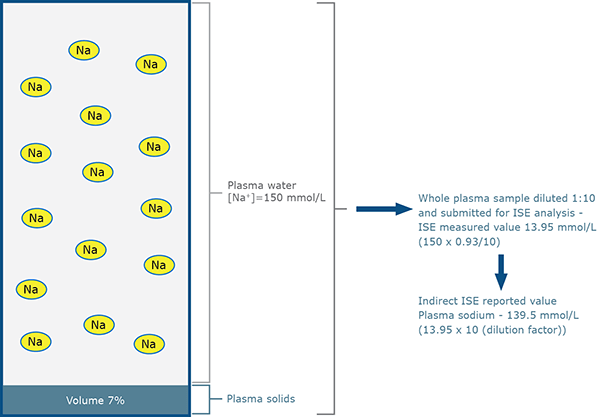
FIG. 2a: Indirect ISE measurement for patient A
(normal sodium status – normal protein and lipid)
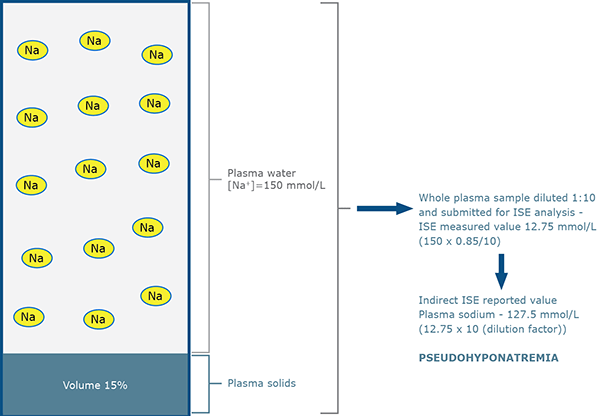
FIG. 2b: Indirect ISE measurement for patient B
(normal sodium status – increased lipid)
Consider two patients A and B with identical (normal) concentration of sodium in plasma water (150 mmol/L); patient A has normal lipid and protein concentration and so has a plasma water volume of 93 %.
Patient B has increased plasma lipid concentration and therefore reduced plasma water volume, in this case 85 %. The plasma samples of both patients are submitted for sodium estimation by ”direct” ISE (Figs. 1a, 1b) and ”indirect” ISE (Figs. 2a, 2b).
As outlined above, change in lipid and/or protein concentration does not affect direct ISE measurement so results are identical.
However, the predilution (1:10) process of indirect ISE measurement results in fewer sodium ions being presented to the electrode in the case of patient B because in unit volume of plasma, less is occupied by water where the sodium resides (85 % compared with 93 %).
The sodium ions present in sample B are effectively diluted more (by the factor 93/85) than those present in sample A. This so-called ”water exclusion” or ”water displacement” effect results in a theoretical measured sodium concentration of 12.75 mmol/L (150 × 0.85) for diluted sample B, rather than 13.95 mmol/L (150 × 0.93) for diluted sample A.
After taking into account the sample dilution (1:10), the indirect ISE reported values are 139.5 mmol/L for sample from patient A, but only 127.5 mmol/L for sample from patient B.
Despite having a normal concentration of sodium in plasma water, patient B is apparently hyponatremic due to raised lipids. The term pseudohyponatremia is applied to this spuriously reduced sodium result.
Pseudohyponatremia is defined as spuriously low plasma sodium concentration (<135 mmol/L) due to the presence of increased plasma lipid and/or increased plasma protein concentration.
Patients with pseudohyponatremia are ”truly” normonatremic (plasma osmolality is normal). Since ”direct” ISE methods are unaffected by change in protein or lipid concentration, pseudohyponatremia can, by definition, only occur if ”indirect” ISE (or FES) methods are used to measure sodium.
The term pseudohyponatremia is sometimes inappropriately applied to the hypertonic hyponatremia that results most frequently from severe hyperglycemia in diabetic ketoacidosis [16].
It is an inappropriate use of the term because the hyponatremia in such cases is real (it results from the movement of water from cells to ECF due to the osmotic effect of glucose; sodium is effectively diluted but plasma osmolality is normal or increased).
In cases of hypertonic hyponatremia, sodium values are reduced irrespective of the ISE measuring methodology. In common with pseudohyponatremia, hypertonic hyponatremia should not be treated as if there were sodium loss, and it is this commonality that perhaps explains the inappropriate use of the term.
CONDITIONS THAT CAN RESULT IN PSEUDOHYPONATREMIA
The conditions that are associated with a rise in plasma protein or lipid concentration of sufficient severity to cause pseudohyponatremia are individually rare, and can be divided into those in which marked increase in plasma protein concentration (usually > 100 g/L) is the problem:
- Multiple myeloma, Waldenstrom’s macroglobulinemia [17-19]
- Hypergammaglobulinemia due to liver disease [20]
- IV administration of gamma globulins [21]
And those in which marked increase in blood lipids (most commonly raised triglycerides, less commonly raised cholesterol [15]) is the problem:
- Obstructive liver disease with associated lipoprotein X [22, 23]
- Diabetic ketoacidosis with associated severe hypertriglyceridemia [18, 24, 25]
- Acute pancreatitis with associated severe hypertriglyceridemia [26].
CONFIRMING PSEUDOHYPONATREMIA
The simplest way of confirming that plasma sodium concentration is spuriously low, is to reanalyze the sample using a direct ISE method; pseudohyponatremia is confirmed if direct ISE value is normal, and excluded if it is similar to the original reduced indirect ISE result.
If direct ISE is not available, simultaneous calculation and measurement of plasma osmolarity is very useful [27]. Measured osmolarity is normal in pseudohyponatremia but calculated osmolarity – based as it is on erroneously low plasma sodium result – is reduced. An increased osmolar gap (i.e. the difference between measured and calculated osmolarity) suggests pseudohyponatremia.
FAILURE TO RECOGNIZE PSEUDOHYPONATREMIA CAN HAVE SERIOUS CONSEQUENCES - A CASE STUDY
Pseudohyponatremia is an artefact that should not be treated. The following case study [25] demonstrates the potential danger of failing to recognize pseudohyponatremia and treating as if it were ”true” hyponatremia.
A 6-year-old, insulin-dependent diabetic boy was admitted to hospital in a comatose and dehydrated state following 2 weeks of intermittent vomiting and abdominal pain. Opthalmoscopic examination revealed an abnormality of the eyes (lipemia retinalis) that is caused by severe hyperlipidemia.
Blood testing revealed metabolic acidosis, severe hyperglycemia (blood glucose 37 mmol/L) and severe hyponatremia (serum sodium 89 mmol/L). The laboratory reported that the serum was ”strikingly lipemic”.
Later analysis of this admission sample would reveal that serum triglyceride concentration was 223 mmol/L and cholesterol concentration 41.4 mmol/L. No connection was made between the severe hyperlipidemia and hyponatremia.
Since pseudohyponatremia was not recognized, the apparent hyponatremia was treated inappropriately with 0.9 % saline, beginning 2 hours after admission. As a result of the saline treatment serum sodium increased to 116 mmol/L at 7 hours after admission but there was clinical evidence (right hemiplegia and tonic convulsions) of evolving brain damage.
The child’s condition deteriorated and he died 33 hours after admission due to brain hemorrhage. The 7 hours post admission serum sample with apparent sodium of 116 mmol/L was treated to remove the lipids and reanalyzed. The true serum sodium was found to be 222 mmol/L.
The inappropriate treatment had caused very severe hypernatremia and associated encephalopathy that almost certainly contributed to the boy’s death.
References+ View more
- Higgins C. Spurious sodium results (2) – Pseudohypernatremia. www.acutecaretesting.org 2014.
- Upadhyay A, Jaber B, Madias N. Incidence and prevalence of hyponatremia. Am J Med 2006; 119: S30-35.
- Arampatzis S, Frauchiger B, Fiedler GM et al. Characteristics, symptoms and outcome of severe dysnatremia present on hospital admission. Amer J Med 2012; 125: 1125e1-e7.
- Malabu H, Porter D, Vangaveti VN, Kazi M, Kennedy RL. Prevalence of hyponatremia in acute medical admissions in tropical Asia Pacific Australia. Asian Pac J Trop Med 2014; 7: 40-43.
- Pokaharel M, Block C. Dysnatremia in the ICU. Curr Opin Crit Care 2011; 17: 581-93.
- Funk G, Linder G, Druml W et al. Incidence and prognosis of dysnatremias present on ICU admission. Int Care Med 2010; 36: 304-11.
- Stelfox H, Ahemd S, Khandwalla F. The epidemiology of intensive care unit-acquired hyponatremia and hypernatremia in medical-surgical intensive care units. Critical Care 2008; 12: R162
- Arieff A. Hyponatremia, convulsions, respiratory arrest and permanent brain damage after elective surgery in healthy women. N Eng J Med 1986; 314: 1535-42.
- Hoorn E, Zietse R. Hyponatremia and mortality: moving beyond associations. Am J Kidney Dis 2013; 62: 139-49.
- Hald P. The flame photometer for the measurement of sodium and potassium in biological materials. J Biol Chem 1949; 167: 499-510.
- Levy G. Determination of sodium with ion selective electrodes. Clin Chem 1981; 27: 1435-38.
- Apple F, Koch D, Graves S, Ladenson JH. Relationship between direct- potentiometric and flame-photometric measurement of sodium in blood. Clin Chem 1982; 28: 1931-35.
- Waugh W. Utility of expressing serum sodium per unit of water in assessing hyponatremia. Metabolism 1969; 18: 706-11.
- Weisberg L. Pseudohyponatremia: A Reappraisal. Amer J Med 1989; 86: 315-18.
- Fortgens P, Pillay T. Pseudohyponatremia Revisited. Arch Pathol Lab Med 2011; 135: 516-19.
- Bertholf R. What is pseudohyponatremia? AACC 2011 www.aacc.org/members/nacb/NACBBlog/lists/posts/post.aspx?ID=9. Accessed Feb 2014.
- Zhongxin Y, Parker M, Blick K. Markedly decreased serum sodium concentration in a patient with multiple myeloma. LABMEDICINE 2005; 36: 224-26.
- Forrest A, Shenkin A. Dangerous pseudohyponatremia. Lancet 1980; 316: 1121
- Ladenson J, Apple F, Aguanno J, Koch DD. Sodium measurements in multiple myeloma: two techniques compared. Clin Chem 1982; 28: 2383-86.
- Garibaldi B, Cameron S, Choi M. Pseudohyponatremia in a patient with HIV and hepatitis C Coinfection. J Gen Int Med 2007; 23: 202-05.
- Steinberger B, Ford S, Coleman T. Intravenous immunoglobulin therapy in post-infusional hyperproteinemia, increased serum viscosity, and pseudohyponatremia. Am J Hematol 2003; 73: 97-1000.
- Riche E, Burgess L, Marais A. Pseudohyponatremia in a patient with obstructive jaundice. Clin Chim Acta 2006; 366: 357-60.
- Vo H, Gosmanov A, Garcia-Rosell M. Pseudohyponatremia in acute liver disease. Am J Med Sci 2013; 345: 62-64.
- Lai M-Y, Lin CC, Chung SL Wu CH, Yang WC, Tseng YT. Milky plasma, diabetes and severe hyponatremia. Kidney Int 2009; 75: 996.
- Frier B, Steer C, Baird J, Bloomfield S. Misleading plasma electrolytes in diabetic children with hyperlipidemia. Arch Dis Childhood 1980; 55: 771-775.
- Howard J, Reed J. Pseudohyponatremia in acute hyperlipemic pancreatitis. Arch Surg 1985; 120: 1053-55.
- Goh K. Management of hyponatremia. Am Fam Physician 2004; 69: 2387-94.
References
- Higgins C. Spurious sodium results (2) – Pseudohypernatremia. www.acutecaretesting.org 2014.
- Upadhyay A, Jaber B, Madias N. Incidence and prevalence of hyponatremia. Am J Med 2006; 119: S30-35.
- Arampatzis S, Frauchiger B, Fiedler GM et al. Characteristics, symptoms and outcome of severe dysnatremia present on hospital admission. Amer J Med 2012; 125: 1125e1-e7.
- Malabu H, Porter D, Vangaveti VN, Kazi M, Kennedy RL. Prevalence of hyponatremia in acute medical admissions in tropical Asia Pacific Australia. Asian Pac J Trop Med 2014; 7: 40-43.
- Pokaharel M, Block C. Dysnatremia in the ICU. Curr Opin Crit Care 2011; 17: 581-93.
- Funk G, Linder G, Druml W et al. Incidence and prognosis of dysnatremias present on ICU admission. Int Care Med 2010; 36: 304-11.
- Stelfox H, Ahemd S, Khandwalla F. The epidemiology of intensive care unit-acquired hyponatremia and hypernatremia in medical-surgical intensive care units. Critical Care 2008; 12: R162
- Arieff A. Hyponatremia, convulsions, respiratory arrest and permanent brain damage after elective surgery in healthy women. N Eng J Med 1986; 314: 1535-42.
- Hoorn E, Zietse R. Hyponatremia and mortality: moving beyond associations. Am J Kidney Dis 2013; 62: 139-49.
- Hald P. The flame photometer for the measurement of sodium and potassium in biological materials. J Biol Chem 1949; 167: 499-510.
- Levy G. Determination of sodium with ion selective electrodes. Clin Chem 1981; 27: 1435-38.
- Apple F, Koch D, Graves S, Ladenson JH. Relationship between direct- potentiometric and flame-photometric measurement of sodium in blood. Clin Chem 1982; 28: 1931-35.
- Waugh W. Utility of expressing serum sodium per unit of water in assessing hyponatremia. Metabolism 1969; 18: 706-11.
- Weisberg L. Pseudohyponatremia: A Reappraisal. Amer J Med 1989; 86: 315-18.
- Fortgens P, Pillay T. Pseudohyponatremia Revisited. Arch Pathol Lab Med 2011; 135: 516-19.
- Bertholf R. What is pseudohyponatremia? AACC 2011 www.aacc.org/members/nacb/NACBBlog/lists/posts/post.aspx?ID=9. Accessed Feb 2014.
- Zhongxin Y, Parker M, Blick K. Markedly decreased serum sodium concentration in a patient with multiple myeloma. LABMEDICINE 2005; 36: 224-26.
- Forrest A, Shenkin A. Dangerous pseudohyponatremia. Lancet 1980; 316: 1121
- Ladenson J, Apple F, Aguanno J, Koch DD. Sodium measurements in multiple myeloma: two techniques compared. Clin Chem 1982; 28: 2383-86.
- Garibaldi B, Cameron S, Choi M. Pseudohyponatremia in a patient with HIV and hepatitis C Coinfection. J Gen Int Med 2007; 23: 202-05.
- Steinberger B, Ford S, Coleman T. Intravenous immunoglobulin therapy in post-infusional hyperproteinemia, increased serum viscosity, and pseudohyponatremia. Am J Hematol 2003; 73: 97-1000.
- Riche E, Burgess L, Marais A. Pseudohyponatremia in a patient with obstructive jaundice. Clin Chim Acta 2006; 366: 357-60.
- Vo H, Gosmanov A, Garcia-Rosell M. Pseudohyponatremia in acute liver disease. Am J Med Sci 2013; 345: 62-64.
- Lai M-Y, Lin CC, Chung SL Wu CH, Yang WC, Tseng YT. Milky plasma, diabetes and severe hyponatremia. Kidney Int 2009; 75: 996.
- Frier B, Steer C, Baird J, Bloomfield S. Misleading plasma electrolytes in diabetic children with hyperlipidemia. Arch Dis Childhood 1980; 55: 771-775.
- Howard J, Reed J. Pseudohyponatremia in acute hyperlipemic pancreatitis. Arch Surg 1985; 120: 1053-55.
- Goh K. Management of hyponatremia. Am Fam Physician 2004; 69: 2387-94.
May contain information that is not supported by performance and intended use claims of Radiometer's products. See also Legal info.


Acute care testing handbook
Get the acute care testing handbook
Your practical guide to critical parameters in acute care testing.
Download now
Scientific webinars
Check out the list of webinars
Radiometer and acutecaretesting.org present free educational webinars on topics surrounding acute care testing presented by international experts.
Go to webinars