Printed from acutecaretesting.org
July 2010
The significance of base excess (BEB) and base excess in the extra cellular fluid compartment (BEEcf)


INTRODUCTION
Assessment of the acid-base status of the neonate immediately after birth is important because it provides us with information about the consequences of any decrease in oxygen delivery to the fetus.
Simply measuring pO2 in umbilical blood (venous or arterial) will neither tell us reliably that the fetus is hypoxic [1,2] nor can we estimate the degree of hypoxia [3,1,4]. In the adult, hydrogen ion concentration (cH+) gives a true insight not only into the consequences of hypoxia (metabolic component) but also into respiration disorders (non-metabolic component, i.e. pCO2).
In the fetus pCO2 and base excess (BE) are not
independent but closely combined because the fetus has no pulmonary
respiration; for example, cord encirclements (Fig. 1) may lead to
hypercapnia together with hypoxia and therefore nearly always to a
mixed acidosis.
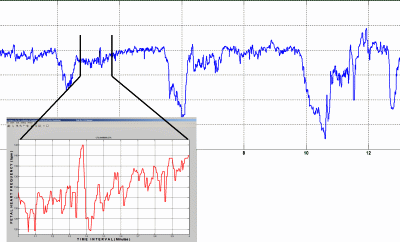
FIG. 1: Foetal heart frequency with amplification of 1 Min.
- Typical FHR recording with variable decelerations due to cord
encirclements. One base-line Minute is amplified
electronically.
In vitro, the metabolic component of an acidosis, BE, is defined as the titratable (t) base (mmol/L), using e.g. NaOH when titrating an acidotic blood sample to the reference pH = 7.40, at pCO2 = 40 mmHg, at T = 37 °C without changing the actual sO2 (%). When BE refers to fully in vitro oxygenated blood it should be specified as BEox.
Recently Siggaard-Andersen proposed [5] to use the term ctH+B rather than BEB because the relevant chemical component is the hydrogen ion, not hydrogen-ion-binding groups (base) nor hydroxyl ions (cOH–).
Both in the adult and in the fetus ctH+B (BEB) in vitro is independent of pCO2 changes [6,5], because the change in bicarbonate is completely balanced by an opposite change in other buffer anions (albuminate and hemoglobinate); in vivo, however, ctH+B does not remain constant [6]:
In vivo, with a rise in pCO2 the pH falls more and the bicarbonate produced rises less than in blood in vitro [7].
This means that ctH+ of whole blood rises in vivo because hydrogen ions move from the poorly buffered interstitial fluid into blood plasma and further into the red cells, where they are buffered by hemoglobin; the result is a redistribution of hydrogen ions throughout the whole extracellular space [6] in which ctH+Ecf remains unchanged. In this context extracellular space refers to interstitial fluid, lymph, plasma and fluid in erythrocytes and other formed elements in blood.
If we want a quantity which is independent of pCO2 changes in vivo, we need to use a model of the extended extracellular fluid (Ecf) since it is not accessible for direct sampling.
We can create such a model assuming that the red cells are evenly distributed throughout this extended Ecf. The hemoglobin concentration (cHb) of this model equals the hemoglobin concentration of the blood times the ratio of the volume of blood divided by the volume of the extended Ecf. It is generally assumed that this ratio normally is around 1/3 and therefore cHbEcf = cHbB / 3 = 5.0 g%. In the fetus/newborn, however, the interstitial volume is larger and the ratio may be close to 1/4 [8].
Blood BE originally referred to fully oxygenated blood because the blood sample was equilibrated in vitro with a gas mixture of 94.4 % O2 and 5.6 % CO2. Later on, in 1964, it was redefined to the actual hemoglobin oxygen saturation (%).
In 1964 Crawford and Holaday [9] recognized a significant effect on
BE of fully oxygenated blood according to the degree of
deoxygenation: In umbilical artery (UA) blood, where oxygenation
normally is low (pO2 about 18 mmHg only [16]),
BEox. values are lower (e.g. –10.0 instead of –7.0
mmol/L (–10 < –8)) when compared to BE values referring to
actual (act) oxygenation; in consequence
ctH+B,ox. is higher than
ctH+B,act.
Reoxygenation of hemoglobin therefore causes an increase in net
titratable hydrogen ion because hydrogen ions are liberated from
so-called oxygen-linked buffer groups (NH+,
NH2+ or NH3+ groups of
the globin); an effect which traditionally is called the HALDANE
effect [10,11].
If we denote BE, which we normally get from the analyzer,
BEact,ox. (not knowing the degree of oxygen desaturation
in vivo) and BE after complete reoxygenation (experimentally
in vitro or by computation)
BEfully ox., the following equation was verified by
Siggaard-Andersen [10]:
BEact,ox. = BEfully ox. + 0.3 × cHb × (1 – sO2), and rearranged
BEfully ox. = BEact,ox. – 0.3 × cHb × (1 – sO2)
This equation looks simple but is not so easily understood because BEB = (ctH+B) × –1 leading to:
–ctH+fully ox. = –ctH+act ox. – 0.3 × cHb × (1 – sO2), multiplied with –1:
ctH+fully ox. = ctH+act ox. + 0.3 × cHb × (1 – sO2)
Now it becomes clear that ctH+fully ox. is the sum of two components: ctH+act ox. (BEact ox.) and the term: 0.3 × cHb × ( 1 – sO2 ) representing the hydrogen ions hidden in the hemoglobin molecules.
Numerically BEfully ox. therefore is besides the bulk of
solved hydrogen ions (BEact ox.), a function both of
cHb (mmol/L) and oxygen saturation of hemoglobin ranging
between 0.0 (when sO2 = 1.0, i.e. 100 %) and
approx. 5.0 mmol/L (when sO2 = 0 %: 15 × 0.3 =
5).
Full oxygenation liberates hydrogen ions from hemoglobin
corresponding to about 0.3 mol/mol, i.e. 0.3 mol H+ per
mol oxygen.
The figure 0.3 is called the Haldane coefficient. (Note: If
cHb is measured in g/dL, the Haldane coefficient (0.306)
must be divided by 1.6114 to convert to mmol/L; thus 0.3 / 1.6114 =
0.19, (the molar mass of hemoglobin monomer being 16.114
g/mol)).
To be shorter in the following we denote: BEact ox. = BEact and BEfully ox. = BEox. Note that generally: ctH+B,ox. > ctH+B,act because due to reoxygenation all hydrogen ions in the sample are available, i.e. they become titratable and consequently BEox. < BEact (–6 < –2).
For example: If the actual oxygen saturation is 50 % (sO2 = 0.5) and the initial pH is 7.40 with pCO2 = 40 mmHg (therefore per definition BEact = 0) and the hemoglobin concentration amounts to 10 mmol/L (16.1 g%), complete oxygenation in vitro would produce 1.5 mmol of hydrogen ions and BEox. = –1.5 since: 0 – 0.30 × 10 × (1 – 0.5) = –1.5;
In vivo, however, the 1.5 mmol of hydrogen ions (BEox. = –1.5) are quickly distributed throughout the whole extracellular space and therefore the rise in ctH+ would be only 1.5 / 3 = 0.5 mmol/L; in the fetus/neonate the increase in ctH+ will be even less (e.g. 1.5 / 4 = 0.37 mmol/L) since the extracellular space in the fetus is significantly larger when compared with the space in an adult [12,8]:
BEEcf,act = BEEcf,ox. + 0.3 × cHbEcf × (1 – sO2)
This is the main reason for using ctH+Ecf,act (BEEcf,act), currently called Standard BE (SBE) indicating the true, i.e. reduced accumulation of cH+ in the extended extracellular fluid compartment (Ecf).
For the clinician it is necessary to understand the difference between ctH+B referring to whole blood (B,(in vitro)) and ctH+Ecf referring to a model of the Ecf in vivo; moreover, the clinician should be aware of the reoxygenation effect leading to: ctH+B,ox. and ctH+Ecf,ox.
Furthermore, in fetal acid-base studies it is of interest to evaluate the correlation of clinical parameters (e.g. the APGAR score and the fetal heart frequency (FHF)) to the spectrum of these four metabolic acid-base variables, the "base excess family" (Table I). Therefore the question must arise: Which base excess should preferably be used?
TABLE I - The base excess family:
|
BEB,act |
ctH+B,act |
Normal BE B |
|
BEEcf,act |
ctH+Ecf,act |
Standard BE |
|
BEB,ox. |
ctH+B,ox. |
"Corrected" to 100 % oxygen saturation of Hb |
|
BEEcf,ox. |
ctH+Ecf,ox. |
"Corrected" to 100 % oxygen saturation of Hb |
The second column refers to the new nomenclature according to Siggaard-Andersen [3] where c = concentration, t = titratable and H+ = hydrogen ions. B = Whole blood, Ecf = Extracellular fluid compartment, act = actual oxygenation of hemoglobin, ox. = fully oxygenated blood.
Note: –ctH+ = BE.
METHODS
The FHR signals (i.e. R-R intervals) of 637 fetuses were recorded by a computer. During a period of 10 years (2000-2009) all recordings were realized in the Frauenklinik of the Klinikum Lippe Detmold GmbH (East Westfalia/Lippe, Germany, (Head: Prof. Dr. med. V. M. Roemer)) including also some premature infants.
To enter the study all fetuses must have been delivered by the vaginal route – thus without a significant loss of FHR signals. During forceps/vacuum delivery recordings were continued. Short-lasting (< 20 sec.) signal losses were overcome by signal-repair algorithms developed in this institution [13].
If necessary, a new electrode was inserted. Recordings of fetuses with chorioamnionitis and tracings of malformed neonates were excluded. No drugs were given during the time of recording. Thus 475 recordings were left. In this study only the last 30 minutes were analyzed using our own MATLAB programs [14].
FHF can be evaluated quantitatively by computer using a new formula:
WAS index = (fhm × w1) × (ozf × w2) × (oza ×w3)–1,
where fhm is mean heart frequency/min. (bpm), ozf is the number of turning points (N/min.) and oza denotes oscillation amplitude/min. (bpm) (Figs. 1 and 2).
The weighting functions w1, w2 and w3 can hardly be guessed by intuition and therefore were determined by an optimization program designed to maximize the correlation coefficient, r between actual pHUA and the WAS score.
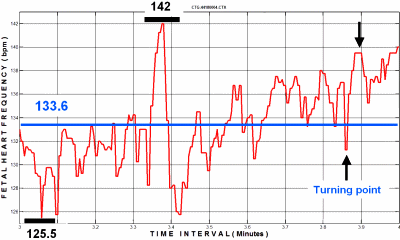
FIG. 2: FHF: Mean frequency (133.6 bpm), Osc.- amplitude :
(142 – 125.5 = 16.5 bpm), Number of turning points
(labelled with arrows): N = 61 / Min. - The three variables
constituting the WAS index are computed; two turns (of 61 in this
minute) are labeled with arrows.
The mean of the WAS index, determined for the last 30 minutes before delivery was denoted "WAS score" [14].
Acid-base variables including actual blood gases were determined in blood of the umbilical artery (and vein) immediately after delivery by trained personal. Radiometer (Copenhagen) equipment was used (ABL500).
APGAR scores after 1, 5 and 10 minutes refer to the fetal reaction pattern mirroring the whole birth process including hypoxia and acidosis, using five variables of neonatal vigor. No fetus delivered with general anesthesia was included in this study.
The Van Slyke equation
Base excess is defined as the negative value of the concentration (c) of titratable (t) hydrogen ion in blood (B); thus BE = – ctH+B. It may be determined directly experimentally.
The endpoint of in vitro titration is pH = 7.40 at pCO2 = 5.33 kPa (40 mmHg) at T = 37.0 °C. The concentration of total oxygen must be held constant during this procedure.
In daily practice ctH+B is determined by calculation using a formula first given by Siggaard-Andersen in his doctoral thesis in 1963.
In 1976 Siggaard-Andersen renamed the equation after Donald Dexter Van Slyke, Rockefeller Institute N.Y. (1883-1971), honoring the outstanding contributions of his compatriot to acid-base physiology [15,8]. Originally [15] the formula given in 1963 (Hb in mmol/L) is:
cHCO3– – 24.4 = –(2.3 × cHbB + 7.7) × (pHP – 7.4) + BEB × (1 – 0.023 × cHbB)–1
using cHCO–3P – 24.4 = ∆HCO3–, pHP – 7.4 = ∆pH and (2.3 × cHbB + 7.7) = ß
simplifies the equation to
BEB = (1 – 0.023 × cHbB) × [ß × ∆pH + ∆cHCO3–]
BEEcf is calculated using cHbB multiplied by the volume fraction of blood in the extended extracellular space, i.e. 0.33 by default as mentioned before. A somewhat lower value, e.g. 0.25 should be used in the newborn [12] because the Ecf in the fetus and thus the dilution effect is larger.
A very simplified and thus practical equation for calculating ctH+Ecf is:
ctH+Ecf = –14.0 × ∆pH – ∆cHCO3–
where fetal hemoglobin concentration as a true variable is ignored and bicarbonate is not 24.4 (see above) but 25.0 mmol/L. If hemoglobin and the low fetal protein concentration are taken into account, the factor 14 changes to ß = 5.5 (7.7 in the adult) + 0.4 × cHbB, i.e. 11.5 with cHbB = 15.0 g/dL [16].
In this version we have ignored the fact that bicarbonate refers to plasma bicarbonate, which is higher than the bicarbonate concentration of whole blood. If we take this into account also, we should multiply the result with 0.93 or the term (1 – 0.005 × cHbB (g/dL) since 1 – 0.005 × 15.0 = 0.925) [16].
Fetal bicarbonate (cHCO3–) in plasma (P) is always determined using the Henderson-Hasselbalch equation:
cHCO3–P = 0.0306 × pCO2 × 10(pH – 6.1)
where pCO2 is given in mmHg (if pCO2 is given in kPa, 0.0306 changes to 0.231).
For example: Given a pH of 7.0, pCO2 =
84.0 mmHg, cHb=15.2 g/dL, and assuming that the blood volume
constitute 1/3 of the extended extracellular fluid volume,
computation for the adult (!) leads to
ctH+B,act = 14.6 and
ctH+Ecf,act = 10.3 (both in mmol/L).
Applying fetal conditions (pO2=18.0 mmHg,
sO2 = 12.3 % ([17], cHb = 15.2 g% [1]),
and assuming that blood constitutes 1/4 of the extended
extracellular space), ctH+Ecf,act will
be 9.7, i.e. 0.6 lower than for the adult due to the larger
dilution effect of cHb in the extracellular fetal space, and
ctH+Ecf,act will increase from
9.7 to 10.4 (ctH+Ecf,ox.) when
"correction" to 100 % oxygen saturation is performed.
The values in the adult are in excellent accordance with the
figures derived from the Siggaard-Andersen curve nomogram [18] and
the Siggaard-Andersen acid-base chart [19].
Using the simplified formula for computation of BEEcf,act (= –ctH+Ecf,act) and the same data in an adult: cHCO3–P = 0.0306 × 84 × 100.9 = 2.57 × 7.943 = 20.4 and ∆cHCO3– = 20.4 – 25.0 = –4.6; with ∆pH = –0.4
BEEcf,act becomes: –(14 × 0.4) – 4.6 = –10.2 which is close (see above) to –10.3 (both in mmol/L).
In all computations in this study a cHbUA of 15.2 g%, and thus a Haldane coefficient of 0.19 and a divisor of 0.25 for approximation of fetal extracellular fluid compartment, was used [20]. sO2 was computed for HbF according to Ruiz et al. [17]. The JMP software was used for graphical design.
RESULTS
Fetal pO2, pCO2 and BE: Normally in vivo fetal BE, which we get from the analyzer, (ctH+B,act) is closely correlated with pCO2 both measured in UA blood: r = –0.288, P < 10–4, N = 475. Fig. 3 shows that in the extended extracellular fetal fluid compartment ctH+Ecf,act (BEEcf,act) becomes definitely independent from pCO2 : r = –0.0068, P = 0.881, N = 475.
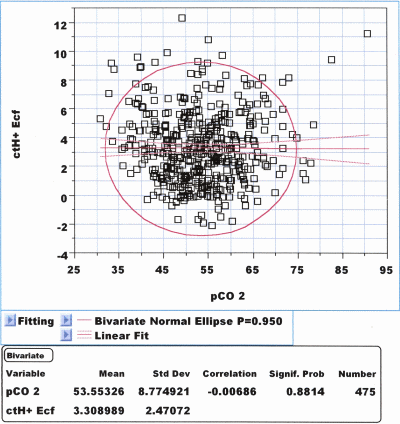
FIG. 3: Correlation diagram between pCO2
(mmHg) and ctH+ (mmol/L) computed for the
extended extracellular fluid compartment
(ctH+Ecf,act): In vivo both
variables are independent from each other: r = 0.
Moreover, it is interesting to note that this correlation becomes insignificant (P < 0.05) already with a divisor of 2 (not 3 or even 4 (accounting for diluted fetal cHbEcf)): r = –0.094, P = 0.040, N = 475. The lowest correlation coefficient is achieved in fetal blood with a divisor of 3.3: r = –0.0015, P = 0.974.
However, with a divisor of about 1000, setting cHb =
0 mmol/L (ctH+P) the coefficient is
(steadily) increased again to –0.155, P = 0.0007, N = 475.
UA blood is dependent of pCO2 and
pO2: both blood gases are closely and inversely
correlated: r = –0.291, P << 10–4, N = 475.
Moreover, pO2 (mmHg) shows no correlation with ctH+B,act (r = –0.074, P = 0.105) but correlates well again with ctH+Ecf,act : r = –0.1722, P = 0.0002. pCO2, however, shows a complementary reaction pattern: pCO2 is closely correlated with ctH+B,act: r = –0.288 (see above) and is definitely independent from ctH+Ecf,act (see above) due to the redistribution effect in vivo.
If ctH+B,act (BEB) is "corrected" to full oxygen saturation, named ctH+B,ox., the coefficient r with pCO2 will increase numerically from –0.288 to –0.345 and with pO2 it will decrease numerically from –0.074 to –0.049.
APGAR scores and ctH+/ctH+Ecf: In this sample the APGAR score 1 min. is best correlated with actual pHUA (r = 0.4078, P < 10–4, N = 475 and Spearman's Rho = 0.307, P < 10–4).
The metabolic components of a fetal acidosis are less closely correlated with this index and "correction" to 100 % oxygen saturation in UA blood always leads to higher coefficients: Using again Spearman's Rho: ctH+B,ox., ctH+B,act, ctH+Ecf,ox. and ctH+Ecf,act provide Rho values of 0.2597, 0.2394, 0.1838 and 0.1763, respectively; P all < 10–4.
The same holds true for APGAR 5 min.: Rho = 0.2307, 0.2168, 0,1811
and 0.1771, respectively.
pCO2 is also closely associated with APGAR 1 min.
(Rho = –0.258, P < 10–4) and APGAR 5 min. (Rho =
–0.214, P < 10–4).
Fetal heart frequency and ctH+B/ctH+Ecf: The same reaction pattern as in APGAR scores can be observed when using computer-evaluated FHR characteristics during the last 30 minutes of delivery: The best correlation is achieved with actual pHUA: r = 0.656, P << 10–4, N = 475 (Fig. 4).
Again, the correlation coefficients (r) with the four metabolic components (Table 1) referring to fetal hypoxia are of minor importance and depend in UA blood again "correction" to fetal oxygen saturation to 100 %:
ctH+B,ox., ctH+B,act, ctH+Ecf,ox. and ctH+Ecf,act lead to r = –0.587, r = –0.565, r = –0.437 and r = –0.427, respectively (P < 10–4 for all). Figs. 4 and 5 show the correlations of the WAS score with pHUA and ctH+Ecf,act, respectively.
In consequence, "correction" of the prevailing fetal oxygen status (sO2,UA) to 100 %, UA seems to be important, yielding always numerically higher coefficients.
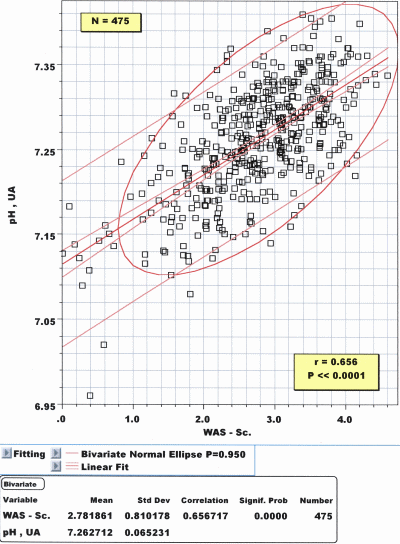
FIG. 4: Correlation diagram between pH in umbilical
artery blood and the WAS score: The correlation is highly
significant: r = 0.656, P << 10–4 and may be used for
clinical purposes.
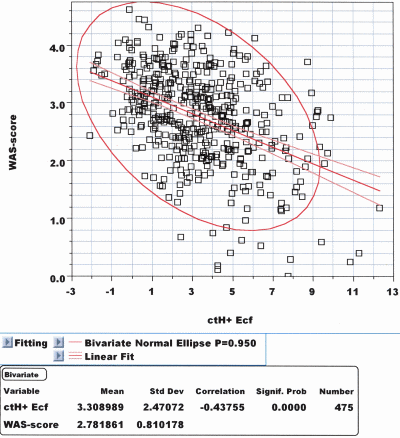
FIG. 5: Correlation diagram between the WAS score and
ctH+Ecf,act, i.e. Standard BE: The correlation coefficient: r is
only –0.427, P << 10–4 which is significantly less than with
actual pHUA (see Fig. 4).
The remaining variables of the fetal acid-base balance determined in UA blood will result in the following four coefficients (r) when correlated with the WAS score: pH: r = 0.657, pCO2: r = –0.501, pO2: r = 0.122 and sO2: r = 0.274, P all < 10–4, except pO2: P = 0.0076.
These highly significant correlations indicate that FHF is an extremely sensitive clinical parameter if it is quantified adequately (WAS index) using electronic devices.
COMMENTS:
1) On first sight it seems impossible to draw any valid clinical conclusions concerning "normal" BE (ctH+B,act), standard BE (ctH+Ecf,act) and the possible need for "correction" to full oxygen saturation of fetal hemoglobin (HbF).
Basically the question must arise [21] if in fetal blood it really makes sense to discern between a metabolic and non-metabolic acidosis since until delivery (i.e. clamping the cord) there is definitely no fetal respiration although breathing movements are visible in sonography.
In fact, the obstetrician is confronted with the strange situation to artificially separate the influence of pCO2 (hypercarbia) and O2 (normally meaning hypoxia) upon cH+B,act (i.e. pH) using ctH+B,act (BEB,act) and furthermore to eliminate the pCO2 effect on ctH+B,act in vivo introducing ctH+Ecf,act (i.e. SBE) whereas in utero definitely no separation is given by nature.
Moreover, there seems to exist no clinical situation in which knowledge of ctH+B,act or ctH+Ecf,act is truly superior to the measurement of only cH+, i.e. actual pH. Only in very severe fetal acidosis the rise of pCO2 is not further increased (> 110 mmHg), most probably due to hypoxic impairment of the whole cellular metabolism.
In summary, from a clinical point of view the obstetrician needs actual pH but not necessarily ctH+Ecf,act, i.e. Standard BE nor BEB,act, i.e. "normal" BE. Today, if necessary, lactate can be measured separately [22].
If isolated alterations of fetal pCO2 occur – this would simulate pure fetal "respiratory" acidosis/alkalosis – maternal hypercarbia (or alternatively hypocarbia due to maternal hyperventilation) seems to be a possible reason often encountered [23]: The correlations between fetal venous (UV) and maternal arterial (art. radialis) blood gases sub partu are very strong (e.g. maternal art. pCO2 vs. pCO2, UV blood: r = 0.514, P < 10–4, N = 101 [23]).
Already in 1962 Saling [24] pointed out that actual pH should be used in fetal acid-base studies instead of pH40 (= BEB,act), still not knowing in 1962 the concept of BEEcf [6].
2) The hydrogen ion in imperceptible concentrations is a potent effector to liberate oxygen from the hemoglobin molecules for fetal tissue oxygen supply.
Deoxygenation thus leads to the appearance of NH+, NH2+ or NH3+ groups in the Hb molecule whereas free titratable hydrogen ions disappear.
If severe hypoxia occurs, the fetal hemoglobin molecules are soaked with hydrogen ions like a sponge filled with water and hemoglobin saturation becomes very low (e.g. around 3.0 % [25]); thus oxygen is delivered to fetal tissues, avoiding at least temporarily hypoxic injuries.
Therefore using the new and logical nomenclature proposed by Siggaard-Andersen [5], abandoning the mentally uncomfortable term BE and remembering again that BEB = –ctH+B:
ctH+Ecf,act = ctH+Ecf,ox. – 0.3 × cHbEcf × (1 – sO2), rearranged:
ctH+Ecf,ox. = ctH+Ecf,act + 0.3 × cHbEcf × (1 – sO2),
where cHb is given in mmol/L and sO2 as fraction.
Most probably this (i.e. ctH+B,ox. > ctH+B,act and BEB,ox. < BEB,act
(–6 < –3)) is the reason why in all computations with the "base excess family", using completely different clinical variables, "correction" (i.e. addition of the term 0.3 × cHbEcf × (1 – sO2)) invariably leads to better, i.e. more significant coefficients; the differences between the coefficients being also highly significant (not shown). Therefore it is tempting to generally recommend "correction" of BEB,act or BEEcf,act to 100 % oxygen saturation in obstetrical acid-base studies [20,26].
This correction procedure, however, might not entirely reflect reality since it combines in vivo and in vitro conditions: In vivo the hydrogen ions liberated by reoxygenation are quickly redistributed.
Therefore ctH+B (BEB) should refer to actual oxygen saturation, i.e. ctH+B,act, not to fully oxygenated blood, i.e. ctH+B,ox., simulating in vitro conditions. This was not taken into account in our last study [20].
Moreover, the link to fetal oxygen status needs the additional measurement (computation) of sO2 (%) for HbF; clinically this might not be worthwhile.
Additionally, ctH+B,ox. (BEB,ox.) greatly overestimates the metabolic component [25] of an acidosis in vivo when compared with BEB,act, the latter being used in the majority of all perinatal acid-base studies in the past:
In a large sample the median ∆ctH+B due to oxygen "correction" (in vitro (!)) amounts to +2.74 mmol/L, the maximum being 5.2 mmol/L [20]. Thus a computed BEB of –20.0 might change to –25.2 mmol/L (BEB,ox.) with acidotic fetal hemoconcentration.
However, if one would adhere to real fetal oxygen status, it is possible to "correct" ctH+Ecf using the same equation but with
cHbEcf = cHbB / 4 (g%):
ctH+Ecf,ox. = ctH+Ecf,act + 0.3 × cHbEcf × (1 – sO2)
Using this concept, however, the difference (∆ctH+Ecf = ctH+Ecf,ox. – ctH+Ecf,act) becomes clinically more or less unimportant:
Mean ∆ctH+Ecf = 0.548 ± 0.090, median = 0.563, range: 0.200-0.710 (mmol/L), N = 475.
This was to be expected since dilution of cHb in the expanded extracellular fetal space (cHbEcf) must reduce the correction effect numerically to about 1/4.
Nevertheless it reflects reality since intrauterine reanimation (always in vivo conditions) possibly with full reoxygenation will result in increased ctH+Ecf values, i.e. ctH+Ecf,ox.
In summary: Fetal Standard BE (ctH+Ecf,act) should be used instead of BEB ("normal" BE) and "correction" to 100 % oxygen saturation makes sense if one would virtually separate fetal hypercarbia from fetal hypoxia in vivo.
References+ View more
- Roemer VM: Messgrößen in der Perinatalmedizin – pO2 und sO2 mit Anmerkungen zur Pulsoxymetrie. Z Geburtsh Neonatol 2005; 209: 173-85.
Andres RL, Saade G, Gilstrap LC et al. Association between umbilical blood gas parameters and neonatal morbidity and death with pathologic fetal acidemia. Am J Obstet Gynecol 1999; 181: 867-71.
Westgate J, Rosen KG. Acid base balance at birth. In: van Geijn HP, Copra FJA eds. A critical appraisal of fetal surveillance. Elsevier B.V. 1994, 595-603.
Garite TJ, Dildy GA, McNamara H, Nageotte MP et al. A multicenter controlled trial of fetal pulse oximetry in the intrapartum management of nonreassuring fetal heart rate patterns. Am J Obstet Gynecol 2000; 183: 1049-58.
Siggaard-Andersen O: Acid-base balance, In: Laurent GJ, Shapiro SD (eds). Encyclopedia of respiratory medicine. Elsevier Ltd, 2006: 5-10; ISBN 0-12-438360-2.
Siggaard-Andersen O. Therapeutic aspects of acid-base disorders. In: Evans FT, Gray TC (eds). Modern trends in anaesthesia. Butterworths, Margate, 1966: 99-131.
Shaw LA, Messer AC. The transfer of bicarbonate between the blood and tissues caused by alterations of carbon dioxide concentration in the lungs. Amer J Physiol 1932; 100: 122-36.
Siggaard-Andersen O. FAQ (22.02.2010): Personal communication.
Crawford JS, Holaday DA. Acid/base disturbances. The Lancet 1964; 834.
Siggaard-Andersen O. Acid/base disturbances (letter): The Lancet 1964; I: 1104.
Siggaard-Andersen O, Garby L. Editorial: The Bohr effect and the Haldane effect. Scand J Clin Lab Invest 1973; 31: 1-8.
Siggaard-Andersen O. Personal communication, March 2010.
Roemer VM, Walden R. Neues Reparaturprogramm für FHF-Kurven, Frauenarzt 2007; 48: 982-89.
Roemer VM, Walden R. Ein neuer Weg zur quantitativen elektronischen CTG-Analyse. Z Geburtsh Neonatol 2010; 214: 1-10.
Siggaard-Andersen O: The Van Slyke Equation. Scand J Clin Lab Invest 1977; Supp 146: 15-20.
Siggaard-Andersen O. Personal communication, 7.5.2010.
Ruiz BC, Tucker WK, Kirby RR. A program for calculation of intrapulmonary shunts, blood-gas and acid-base values with a programmable calculator. Anaesthesiology 1075; 42: 88-95.
Siggaard-Andersen O. The pH, logpCO2 blood acid-base nomogram revised. Scand J Clin Lab Invest 1962; 14: 598-604.
Siggaard-Andersen O. An acid-base chart for arterial blood with normal and pathophysiological reference areas. Scand J Clin Lab Invest 1971; 27: 239-45.
Roemer VM. How to determine and use base excess (BE) in perinatal medicine, Z Geburtsh Neonatol 2007; 211: 1-6.
Kofstad J. All about base excess – to BE or not to BE. http://acutecaretesting.org.
Luttkus, AK, Fotopoulou C, Sehouli J, Stupin J, Dudenhausen JW. Technical performance of lactate biosensors and a test-strip device during labour. Z Geburtsh Neonatol 2010; 214: 62-67.
Roemer VM. The influence of maternal respiration and muscular stress on fetal acid-base balance during delivery – an attempt at quantification. Geburtsh Frauenheilk 2007; 67: 982-92.
Saling E. Das Kind im Bereich der Geburtshilfe. Stuttgart, Thieme, 1996.
Roemer VM, Beyer B. Outcome measures in perinatal medicine – pH or BE. The thresholds of these parameters in term infants, Z Geburtsh Neonatol 2008; 212: 136-46.
Low JA, Linsay BG, Derrick EJ. The threshold of metabolic acidosis associated with newborn complications. Am J Obstet Gynecol 1997, 77: 1391-94.
References
- Roemer VM: Messgrößen in der Perinatalmedizin – pO2 und sO2 mit Anmerkungen zur Pulsoxymetrie. Z Geburtsh Neonatol 2005; 209: 173-85.
Andres RL, Saade G, Gilstrap LC et al. Association between umbilical blood gas parameters and neonatal morbidity and death with pathologic fetal acidemia. Am J Obstet Gynecol 1999; 181: 867-71.
Westgate J, Rosen KG. Acid base balance at birth. In: van Geijn HP, Copra FJA eds. A critical appraisal of fetal surveillance. Elsevier B.V. 1994, 595-603.
Garite TJ, Dildy GA, McNamara H, Nageotte MP et al. A multicenter controlled trial of fetal pulse oximetry in the intrapartum management of nonreassuring fetal heart rate patterns. Am J Obstet Gynecol 2000; 183: 1049-58.
Siggaard-Andersen O: Acid-base balance, In: Laurent GJ, Shapiro SD (eds). Encyclopedia of respiratory medicine. Elsevier Ltd, 2006: 5-10; ISBN 0-12-438360-2.
Siggaard-Andersen O. Therapeutic aspects of acid-base disorders. In: Evans FT, Gray TC (eds). Modern trends in anaesthesia. Butterworths, Margate, 1966: 99-131.
Shaw LA, Messer AC. The transfer of bicarbonate between the blood and tissues caused by alterations of carbon dioxide concentration in the lungs. Amer J Physiol 1932; 100: 122-36.
Siggaard-Andersen O. FAQ (22.02.2010): Personal communication.
Crawford JS, Holaday DA. Acid/base disturbances. The Lancet 1964; 834.
Siggaard-Andersen O. Acid/base disturbances (letter): The Lancet 1964; I: 1104.
Siggaard-Andersen O, Garby L. Editorial: The Bohr effect and the Haldane effect. Scand J Clin Lab Invest 1973; 31: 1-8.
Siggaard-Andersen O. Personal communication, March 2010.
Roemer VM, Walden R. Neues Reparaturprogramm für FHF-Kurven, Frauenarzt 2007; 48: 982-89.
Roemer VM, Walden R. Ein neuer Weg zur quantitativen elektronischen CTG-Analyse. Z Geburtsh Neonatol 2010; 214: 1-10.
Siggaard-Andersen O: The Van Slyke Equation. Scand J Clin Lab Invest 1977; Supp 146: 15-20.
Siggaard-Andersen O. Personal communication, 7.5.2010.
Ruiz BC, Tucker WK, Kirby RR. A program for calculation of intrapulmonary shunts, blood-gas and acid-base values with a programmable calculator. Anaesthesiology 1075; 42: 88-95.
Siggaard-Andersen O. The pH, logpCO2 blood acid-base nomogram revised. Scand J Clin Lab Invest 1962; 14: 598-604.
Siggaard-Andersen O. An acid-base chart for arterial blood with normal and pathophysiological reference areas. Scand J Clin Lab Invest 1971; 27: 239-45.
Roemer VM. How to determine and use base excess (BE) in perinatal medicine, Z Geburtsh Neonatol 2007; 211: 1-6.
Kofstad J. All about base excess – to BE or not to BE. http://acutecaretesting.org.
Luttkus, AK, Fotopoulou C, Sehouli J, Stupin J, Dudenhausen JW. Technical performance of lactate biosensors and a test-strip device during labour. Z Geburtsh Neonatol 2010; 214: 62-67.
Roemer VM. The influence of maternal respiration and muscular stress on fetal acid-base balance during delivery – an attempt at quantification. Geburtsh Frauenheilk 2007; 67: 982-92.
Saling E. Das Kind im Bereich der Geburtshilfe. Stuttgart, Thieme, 1996.
Roemer VM, Beyer B. Outcome measures in perinatal medicine – pH or BE. The thresholds of these parameters in term infants, Z Geburtsh Neonatol 2008; 212: 136-46.
Low JA, Linsay BG, Derrick EJ. The threshold of metabolic acidosis associated with newborn complications. Am J Obstet Gynecol 1997, 77: 1391-94.
May contain information that is not supported by performance and intended use claims of Radiometer's products. See also Legal info.


Acute care testing handbook
Get the acute care testing handbook
Your practical guide to critical parameters in acute care testing.
Download now
Related webinar
Evolution of blood gas testing Part 1
Presented by Ellis Jacobs, PhD, Assoc. Professor of Pathology, NYU School of Medicine.
Watch the webinar