Printed from acutecaretesting.org
January 2005
Understanding the principles behind blood gas sensor technology


Historical outline
But let us first make a quick historical detour to determine the roots of what we call blood gas sensors (for an authoritative account by some of the pioneers, see [1]).
-
The pH electrode
This electrode was developed, or rather discovered, in the beginning of the previous century, when it was found that a thin glass membrane separating two solutions differing in pH could develop a small difference in electrical potential.
In the beginning it was very difficult to measure this potential, but with improvements in electronics it became practically feasible and instruments that could measure pH were built. -
The pCO2 sensor
Much later, actually more than half a century later, the discovery of the pH electrode enabled the development of the pCO2 sensor by American scientists Stow and Severinghaus.
Stow used a glass pH electrode, which was covered by a plastic membrane. A Ag/AgCl reference electrode was placed under the membrane as well. J. W. Severinghaus improved this design by adding a source of bicarbonate ions to the electrolyte solution.
By doing this, the pH of the inner solution became linked to the partial pressure of pCO2 outside the membrane by a simple mathematical equation, now commonly known as the Henderson-Hasselbalch equation. -
The pO2 sensor
The pO2 sensor was finally added by L. C. Clark and shortly thereafter built into a combined instrument by J. W. Severinghaus. This instrument is now commonly referred to as the first blood gas analyzer in the world.
The pO2 sensor was designed as a membrane-covered electrode. It had a very thin platinum wire melted into a glass rod. The covering plastic film reduced the flux of oxygen molecules to the platinum surface, so when the electrode was polarized appropriately, the oxygen reduction current was proportional to the partial pressure of oxygen.
This idea of reducing the flux of molecules to the electrode surface by the application of a plastic membrane has later been used in many other sensors, for instance the ubiquitous glucose sensor.
The working principles of these sensors are illustrated in the table below.
| pH |  |
| pCO2 |  |
| pO2 |  |
Scientific challenges to designers of today
Today’s challenge when dealing with these well-known sensors is hence to provide:- Intimate understanding of the basic physical chemistry and electrochemistry of the sensor
- Selection of optimal materials that provide the desired sensor function(s)
- Physical characterization methods that allow monitoring of material properties of the sensors. This could be surface roughness, chemical impurities, etc.
The job is even more important today because of the ongoing miniaturization trend. The hope is, of course, that smaller sensors will lead to "better" analyzers, as mentioned in the introduction, but it may not necessarily be straightforward.
When the scientific principles of the sensor are well understood, it often becomes clear that the design issues remain the same as in traditional sensors. As an example of this, some considerations on what determines the response time of the Severinghaus pCO2 sensor is presented in Example 1.
On the chemical side it is also the same fundamental (electro)chemical laws that govern small sensors as well as conventional sensors. These laws impose restrictions on the sensors, and this is illustrated by an example involving the oxygen sensors.
The reaction in question is comprised of a series of simpler reactions that in combination lead to the electrochemical reduction of oxygen. If one of the simpler reactions is not as fast as it is supposed to be, it has become "rate limiting", and some of the electrical current may be "lost", at least temporarily, if ignored.
This may delay the sensor response, as explained in Example 2.
Example 1
Response time of the pCO2
sensor
Most blood gas analyzers deploy
multiple-use sensors located in complicated flow cells. The liquids
and gases flow over the sensors in lengthy, and sometimes almost
incomprehensible, measurement cycles.
The actual acquisition of the sensor signals necessary to compute the readout of a given sensor takes place only during a small fraction of the time required for a complete measurement cycle. In the remaining part of the measurement cycle the analyzer works to establish a good starting point for the next measurement. Thus very little time is allotted to the sensor response, and therefore the sensors should be as fast as possible.
Ideally, they should be so fast that they can reach equilibrium within the signal-acquisition period.
In the real world this can be achieved only in rare situations for some sensors, and in the case of the pCO2 sensor one finds that even the fastest sensor will still be changing (slightly) during the signal acquisition.
In these cases it becomes desirable to be able to calculate end points of the responses, i.e. extrapolate what the signals would have been, had they been allowed to reach their final values.
Such predictions should preferably be made on the basis of a mathematical model of the sensor, but can sometimes also be done empirically. In the cases where mathematical models are used, one often finds that the sensor responses follow simple mathematical expressions such as an exponential function or maybe sums of two such functions.
In order to understand which material properties and physical dimensions govern the sensor responses, it is necessary to "model" the sensor in a more complete manner, and one often sees that the sample phase is included in such modeling, see e.g. [2,3].
The table below lists some important physical processes that must be considered in a pCO2 sensor model:
|
Breakdown of processes for the
pCO2 sensor
|
|
|
|
Process no.:
|
A mathematical model based on all the steps above would be very complicated, as the processes are mixed. This means that some are transport processes (processes no. 1-4), while others, such as the sequence: CO2 ® HCO3– ® H2CO3 (the "bicarbonate" system), consist of homogeneous chemical reactions (process no. 5) that take place between dissolved species in aqueous solution. The last reaction, the ion-exchange reaction between protons and Li+ ions on the glass surface (process no. 6), is still a matter of investigation.
Simplification is needed and experience shows that diffusion of CO2 in the solution, in the membrane and in the electrolyte to a very high degree controls the kinetic behavior of the sensor.
Transfer of CO2 from the sample to the membrane and further from the membrane into the electrolyte are thus not rate-determining steps. Nor is the establishment of the equilibrium of the bicarbonate system or, as mentioned, the surface reactions on the glass membrane.
With these assumptions it is possible, with caution, to calculate the sensor response of a pCO2 sensor by considering only diffusion processes. Further simplifications are possible if some geometric assumptions are permitted, e.g. that diffusion occurs only in one dimension.
This is an especially good assumption when the surface area of the sensor is much larger than the thickness of the membranes in front of the glass electrode, which is often the case.
All in all it is possible to derive the following equation, [4]:
Symbols:
- t: Exponential response time
- D: Diffusion coefficient
- S: Solubility of CO2
- e or m: Thickness of electrolyte or membrane
- Subscripts e or m refer to electrolyte or membrane
- e2/De (or m2/Dm) is called the characteristics diffusion time with the dimension seconds
The equation shows that the response time of the sensor as a whole is made up of the mean of the two characteristic diffusion times of the membrane and the electrolyte, respectively, plus something more which depends on the solubility of CO2 in the materials.
With this knowledge it is now possible to make a direct comparison of the relative importance of the membrane and electrolyte, respectively, to the response time of the sensor.
Selection of pCO2
membrane material
In the past, membrane materials used for
pCO2 sensors were often chosen among olefinic
polymers such as polypropylene, polyethylene or its perfluorinated
cousin: Teflon.
These materials could be obtained in a convenient form as "plastic films" or sheets around ½ mil (12.5 mm) thick. pCO2 sensors made with such materials had response times in the order of tens of seconds, in good agreement with the equation above. Thus, in fact, such "first-generation sensors" were quite slow.
Theoretically, it became clear that if the material properties of silicone were inserted in the equation, the response time could be reduced. In the past, however, silicone membranes were not available that were strong enough to be used in the sensors and it posed an additional problem that the membranes could be stretched several hundred percent.
The solution proved to be reinforced silicone membranes, very similar to those used in air bags but much thinner. With such membranes very short response times can be obtained, again in good agreement with the predictions of the equation. Today, commercial sensors with silicone membranes in fact have response times below three seconds, thus showing how theory and experiment agree well.
The inserted picture is an example of a reinforced membrane of the type used in car air bags. The threads of the net (darker shade) are seen surrounded by silicone (lighter shade of gray) in the upper half of the picture.
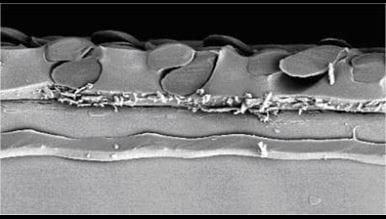
FIG. 1: Reinforced silicone membrane
Understanding the combinations of reactions leading to the reduction of oxygen
The Clark pO2 sensor is another example of a sensor covered with a membrane, but its working principles are quite different from that of the pCO2 sensor. First of all, electrochemical reactions take place at the metallic surface of the innermost part of the sensor, the cathode.
As a result of those reactions O2 is continually removed from the electrolyte. This creates a gradient in the concentration of O2 all the way through the sensor, from the sample to the surface of the metal. The removal of O2 is accompanied by the production of OH– ions that diffuse away from the cathode. The reaction is summarized in the reaction scheme:
![]()
and the table shows a list of relevant processes, both transport processes and chemical reactions.
|
Breakdown of processes for the
pO2 sensor
|
|
|
|
However, the chemical reaction scheme above is merely the electrochemist’s way of accounting for the overall reaction. If the number of reactants on the left side of the arrow are counted, one finds one molecule of oxygen, one molecule of water and four electrons.
If the equation were to depict an actual event, a meeting between molecules, atoms and particles, it would require that all those six entities meet at the same time in space to participate in the reaction. Chemists know that this is highly unlikely, if not impossible.
We must break the summing reaction into smaller, simpler reactions that can happen in the real world. This is a very important part of the chemical subdiscipline called reaction chemistry. It is not yet completely known which sequence of simpler reaction leads to the conversion of O2, but the outline below is thought to be a probable reaction path (a term again taken from reaction chemistry):
| O2 is adsorbed onto the metal of the cathode. | |
| First electron transferred from metal to oxygen. | |
| A proton from the solution is added. It is taken from water and one OH– is formed. | |
| Second electron. | |
| Hydrogen peroxide is formed when another proton is added. The second OH– is formed. | |
| Hydrogen peroxide is decomposed (by a process called disproportionation) into water and oxygen. |
| When all these reactions are added (left-hand sides and right-hand sides are summed) the result is: |
|
|
Although H2O2 is not an end product of the electrochemical reduction of O2, it is apparent from the above sequence that H2O2 plays a key role. We can only add the equations as described (left-hand sides and right-hand sides) if there is no accumulation of H2O2: We need H2O2 to cancel out, so to speak.
If accumulation does take place, we cannot relate the current output of the sensor to the concentration/partial pressure of O2 in the sample. Even if the accumulation is only temporary, it may influence the time dependency of the sensor response and make the evaluation difficult.
pO2 membrane with built-in catalyst for the disproportion of H2O2
It turns out that the noble-metal electrode itself, typically made of platinum, has the ability to catalyze the disproportionation reaction on its surface, which is covered by a thin layer of very active Pt oxides. But as the platinum electrode is a reusable part of the pO2 sensor, its surface conditions may change over time, and so may the catalytic properties on which the disproportionation depends.
This may degrade sensor performance. The solution lies in a modification of the sensor membrane, which is a disposable item. Catalytically active platinum black, a special form of Pt oxide, is bound on the inner side of the membrane. Each time the membrane is renewed, fresh catalyst is brought near to the electrode surface where it helps the reactions proceed according to the theoretical stoichiometry.
Conclusion
Miniaturizing sensors poses challenges such as response time for the pCO2 sensor and the role of H2O2 in O2 sensor reactions. However, these challenges can be met by selecting the right material for a pCO2 membrane and by having a pO2 membrane with a built-in catalyst for the disproportion of H2O2.
Principles behind the optimal functioning of sensors remain the same regardless of their size. Respecting these principles may pose some design challenges, but hopefully also inspire us to come up with more creative solutions.References1. Astrup P, Severinghaus JW. The History of Blood Gases, Acids, and Bases. 1 ed. Copenhagen: Munksgaard, 1986.
2. Jensen MA, Rechnitz GA. Response time characteristics of the pCO2 electrode. Anal Chem 1979; 51,12: 1972-77
3. Samukawa T, Ohta K, Onitsuka M, Ito Y, Motohashi R. Numerical approach to the explanation of the response time of the Severinghaus type electrode. Anal Chim Acta 1995; 316: 83-92.
4. Sørensen PR. Elektrokemiske sensorer: Små elementer af stor betydning. Dansk Kemi 1996; 5: 32-34.
References1. Astrup P, Severinghaus JW. The History of Blood Gases, Acids, and Bases. 1 ed. Copenhagen: Munksgaard, 1986.
2. Jensen MA, Rechnitz GA. Response time characteristics of the pCO2 electrode. Anal Chem 1979; 51,12: 1972-77
3. Samukawa T, Ohta K, Onitsuka M, Ito Y, Motohashi R. Numerical approach to the explanation of the response time of the Severinghaus type electrode. Anal Chim Acta 1995; 316: 83-92.
4. Sørensen PR. Elektrokemiske sensorer: Små elementer af stor betydning. Dansk Kemi 1996; 5: 32-34.


Acute care testing handbook
Get the acute care testing handbook
Your practical guide to critical parameters in acute care testing.
Download now
Related webinar
Evolution of blood gas testing Part 1
Presented by Ellis Jacobs, PhD, Assoc. Professor of Pathology, NYU School of Medicine.
Watch the webinar