Printed from acutecaretesting.org
March 2003
What is p50
Most practitioners try to improve tissue oxygenation by increasing cardiac index, arterial oxygen tension, or hemoglobin concentrations. It is unusual for hemoglobin-oxygen affinity to be considered at these times.
This is because hemoglobin-oxygen affinity has complex effects on tissue oxygenation. In fact, changes in the oxyhemoglobin dissociation curve can have simultaneously opposing actions through oxygen uptake in the lungs versus oxygen unloading in the tissues.
The oxyhemoglobin dissociation curve
The oxyhemoglobin dissociation curve displays the relationship between the oxygen tension of blood and the oxygen saturation (Figure 1). Although the whole curve is the best representation of hemoglobin-oxygen affinity, p50 is often used as the sole descriptor. p50 is the oxygen tension when hemoglobin is 50 % saturated with oxygen. When hemoglobin-oxygen affinity increases, the oxyhemoglobin dissociation curve shifts to the left and decreases p50.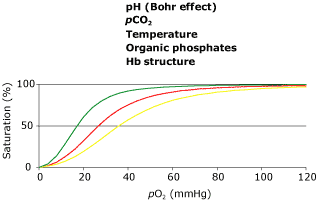
FIG. 1. Three oxyhemoglobin dissociation curves - normal (p50 = 26.7 mmHg (3.5 kPa)), left-shifted (p50 = 17 mmHg (2.3 kPa)), and right-shifted (p50 = 36 mmHg (4.8 kPa)). Factors causing curve shifts are listed on the figure.
Factors which increase p50 include a fall in pH (which is the Bohr effect), high levels of erythrocytic 2,3-diphosphoglycerate (2,3-DPG), and fever. Conversely, raised pH, low 2,3-DPG levels, and hypothermia decrease p50 (Figure 1).
The importance of p50 changes
The oxyhemoglobin dissociation curve is sigmoid shaped. When the curve shifts, the effect is most prominent in the middle around p50. The shift is much less at low and high oxygen tensions (Figure 1).
As a result, extracting the same amount of oxygen from arterial blood with low, normal and high p50 values at sea level will leave the highest venous oxygen tensions (and therefore tissue oxygen tensions) in the blood with the high p50 (Figure 2). However if the same extraction occurs on the top of Mt. Everest, the best result is achieved with the low p50 blood (Figure 2).
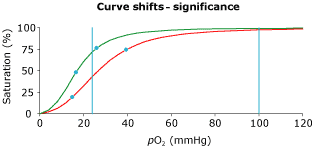
FIG. 2. Two oxyhemoglobin dissociation curves, as in Figure 1. The two vertical lines represent arterial pO2 values at sea level (100 mmHg (13.3 kPa)) and on top of Mt. Everest (28 mmHg (3.7 kPa)). Circles represent venous oxygen tensions after extraction of 5 mL oxygen/100 mL blood. (The venous Bohr effect has not been incorporated.) Note that although a high p50 is advantageous at sea level, a low p50 is preferable at extreme altitude.
The Bohr effect comes into action every time arterial blood traverses the capillaries. While oxygen is being unloaded, pCO2 rises, pH falls, and the curve shifts to the right. The resultant p50 increase maintains a better oxygen diffusion driving pressure, increasing oxygen availability in the average human by about 25 mL/min. In working muscle where there is heat and high CO2 production, this boost to oxygen availability is especially strong.
Standard versus in vivo p50
The standard p50 is the oxygen tension at which hemoglobin is 50 % saturated at pH = 7.4, pCO2 = 40 mmHg (5.3 kPa), temperature = 37 °C with carboxyhemoglobin < 2 %, whereas the in vivo p50 is the oxygen tension at which hemoglobin is 50 % saturated at the pH, pCO2, temperature, and carboxyhemoglobin concentration of the blood in the subject. The standard p50 thus depends primarily on red-cell 2,3-DPG concentrations and hemoglobin structure. The in vivo p50 reflects the total effect of 2,3-DPG, hemoglobin structure, acid-base balance, temperature, and the dyshemoglobins. From the perspective of oxygen loading and unloading, in vivo p50 is what matters. Unless otherwise specified, the term p50 in this paper means in vivo p50.
Calculating the p50
For highly accurate p50 determinations it is necessary to construct the full oxyhemoglobin dissociation curve in the laboratory. However, for clinical purposes, p50 values can be calculated much more simply from a single-point measurement of blood gases and hemoglobin-oxygen saturation. The Siggaard-Andersen Oxygen Status Algorithm is the most useful single-point method [1]. This is because it remains accurate up to a hemoglobin-oxygen saturation of 97 % provided the oxyhemoglobin dissociation curve maintains its shape.
The normal p50
The p50 of each animal species has evolved over the millennia through environmental selection pressures, and presumably is optimal for the tissue oxygen consumption, organ capillary density, and environmental oxygen tension of the animal. The value for humans is 26.7 kPa (3.5 kPa). In general, smaller animals have higher p50 settings (Figure 3).
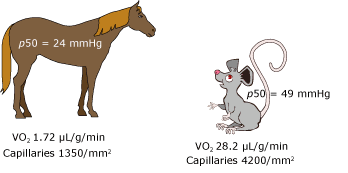
FIG. 3. Comparison of p50 values, tissue oxygen consumption (VO2), and tissue capillary density in the horse and mouse. Note that the four-fold increase in capillary density in the mouse is insufficient to compensate for the sixteen-fold increase in VO2. An increase in p50 is a necessary adaptation.
The p50 in critical illness
In critical illness, many factors affecting p50 can be operating, at times simultaneously. Acidemia increases p50 via the Bohr effect, but at the same time reduces 2,3-DPG production, decreasing p50. Alkalemia does the opposite. Hypophosphatemia reduces 2,3-DPG production and hyperphosphatemia increases it. Prolonged hypoxemia increases 2,3-DPG concentrations and thus p50. Fever increases p50.
The final result is difficult to predict. Recently, a group of Australian critically ill patients were shown to have a normal mean in vivo p50 [2], despite reduced mean 2,3-DPG concentrations (and thus standard p50). This 2,3-DPG reduction was due almost solely to acidemia. Two other studies of critically ill patients also revealed a reduced standard p50, implying low 2,3-DPG concentrations [3,4]. The one exception comes from Belgium, where patients with acute respiratory distress syndrome and marked hypoxemia were found to have elevated 2,3-DPG concentrations [5].
The desirable p50 response to hypoxia
Investigational drugs and hemoglobin substitutes which can reliably alter p50 are now in existence. As a result, much attention is being given to the best way to manipulate p50 (if at all) when tissue oxygen delivery is under threat. In simple terms, the p50 which best preserves mixed venous oxygen tensions is the appropriate defense of mitochondrial oxygenation.
Low ambient oxygen tensions (normal A-a gradient)
Mathematical modeling predicts that a reduced p50 will defend mitochondria against severe environmental hypoxia, and animal and human data support this idea [6]. For example, animals adapted to hypoxic environments such as deep burrows or high altitude have a lower p50 than similar species breathing normal ambient oxygen tensions. Similarly, fetal blood (HbF; p50 = 19.4 mmHg (2.6 kPa)) has a low p50 as an adaptation to the hypoxic conditions in utero.
Critical illness
In contrast, when inadequate tissue oxygen delivery occurs in critical illness, it is virtually never due to ambient hypoxia. With the exception of severe hypoventilation, arterial hypoxemia is normally associated with a raised A-a gradient, usually from lung pathology or (rarely) from intra-cardiac shunting. Critically ill patients also suffer reduced tissue oxygen delivery from varying combinations of low output states and anemia.
Major vascular obstruction can cause severe regional ischemia. In all these scenarios, increasing the p50 should improve venous oxygen tensions for a given oxygen extraction. However, as oxygen delivery continues to fall and the extraction fraction increases, the advantage afforded by increasing p50 will decrease progressively. In extreme hypoperfusion it virtually disappears.
Clinical and experimental data largely support these concepts and are well illustrated by the findings concerning the investigational agent RSR13. RSR13 increases p50 by altering hemoglobin shape and has been shown to increase tissue pO2. Benefits have been seen in experimental tumor irradiation [7], strokes [8], and myocardial ischemia [9].
However, in very high extraction scenarios it loses efficacy [10], and it may even damage organs such as the kidney, where arterio-venous shunting already causes very low tissue oxygen tensions [11,12].
Conclusion
It may soon be possible to achieve significant p50 elevations using artificial hemoglobin solutions or drugs which affect hemoglobin molecular shape. However, despite encouraging theoretical and experimental data, it remains to be established that manipulations of p50 in critical illness can improve gas exchange, tissue oxygenation, or outcome. When we have better evidence that this is true, the status of p50 will warrant routine quantification and consideration.
References+ View more
- Siggaard-Andersen O, Siggaard-Andersen M. The oxygen status algorithm: a computer program for calculating and displaying pH and blood gas data. Scand J Clin Lab Invest 1990; 50, Suppl 203: 29-45.
- Morgan TJ, Koch D, Morris D, Clague A, Purdie DM. Red cell 2,3-diphosphoglycerate concentrations are reduced in critical illness without net effect on in vivo p50 . Anaesth Intensive Care 2001; 29: 479-83.
- Myburgh JA, Webb RK, Worthley LIG. The p50 is reduced in critically ill patients. Intensive Care Med 1991; 17: 355-58.
- Huang W, Cade JF, Pain MC. Oxygen dissociation curve in the adult respiratory distress syndrome. Anaesth Intens Care 1992; 20: 456-59.
- Clerbaux TH, Detry B, Reynaert M, Frans A. Right shift of the oxyhemoglobin dissociation curve in acute respiratory distress syndrome. Path Biol 1997; 45: 269-73.
- Morgan TJ. The significance of the p50 . In: Vincent J-L, editor. 1999 Yearbook of Intensive Care and Emergency Medicine. Berlin Heidelberg: Springer-Verlag, 1999: 433-47.
- Amorino GP, Lee H, Holburn GE et al. Enhancement of tumor oxygenation and radiation response by the allosteric effector of hemoglobin, RSR13. Radiat Res 2001; 156: 294-300.
- Doppenberg EM, Watson JC, Bullock R, Gerber MJ, Zauner A, Abraham DJ. The rationale for and effects of oxygen delivery enhancement to ischemic brain in a feline model of human stroke. Ann NY Acad Sci 1997; 825: 241-57.
- Pagel PS, Hettrick DA, Montgomery MW. Kersten JR, Steffen RP, Warltier DC. RSR13, a synthetic modifier of hemoglobin-oxygen affinity, enhances the recovery of stunned myocardium in anesthetized dogs. J Pharmacol Exp Ther 1998; 285: 1-8.
- Curtis SE, Walker TA, Bradley WE, Cain SM. Raising p50 increases tissue pO2 in canine skeletal muscle but does not affect critical O2 extraction ratio. J Appl Physiol 1997; 83: 1681-89.
- Burke TJ, Malhotra D, Shapiro JI. Effects of enhanced oxygen release from hemoglobin by RSR13 in an acute renal failure model. Kidney Int 2001; 60: 1407-14.
- Wahr JA, Gerber M, Venitz J, Baliga N. Allosteric modification of oxygen delivery by hemoglobin. Anesth Analg 2001; 92: 615-20.
References
- Siggaard-Andersen O, Siggaard-Andersen M. The oxygen status algorithm: a computer program for calculating and displaying pH and blood gas data. Scand J Clin Lab Invest 1990; 50, Suppl 203: 29-45.
- Morgan TJ, Koch D, Morris D, Clague A, Purdie DM. Red cell 2,3-diphosphoglycerate concentrations are reduced in critical illness without net effect on in vivo p50 . Anaesth Intensive Care 2001; 29: 479-83.
- Myburgh JA, Webb RK, Worthley LIG. The p50 is reduced in critically ill patients. Intensive Care Med 1991; 17: 355-58.
- Huang W, Cade JF, Pain MC. Oxygen dissociation curve in the adult respiratory distress syndrome. Anaesth Intens Care 1992; 20: 456-59.
- Clerbaux TH, Detry B, Reynaert M, Frans A. Right shift of the oxyhemoglobin dissociation curve in acute respiratory distress syndrome. Path Biol 1997; 45: 269-73.
- Morgan TJ. The significance of the p50 . In: Vincent J-L, editor. 1999 Yearbook of Intensive Care and Emergency Medicine. Berlin Heidelberg: Springer-Verlag, 1999: 433-47.
- Amorino GP, Lee H, Holburn GE et al. Enhancement of tumor oxygenation and radiation response by the allosteric effector of hemoglobin, RSR13. Radiat Res 2001; 156: 294-300.
- Doppenberg EM, Watson JC, Bullock R, Gerber MJ, Zauner A, Abraham DJ. The rationale for and effects of oxygen delivery enhancement to ischemic brain in a feline model of human stroke. Ann NY Acad Sci 1997; 825: 241-57.
- Pagel PS, Hettrick DA, Montgomery MW. Kersten JR, Steffen RP, Warltier DC. RSR13, a synthetic modifier of hemoglobin-oxygen affinity, enhances the recovery of stunned myocardium in anesthetized dogs. J Pharmacol Exp Ther 1998; 285: 1-8.
- Curtis SE, Walker TA, Bradley WE, Cain SM. Raising p50 increases tissue pO2 in canine skeletal muscle but does not affect critical O2 extraction ratio. J Appl Physiol 1997; 83: 1681-89.
- Burke TJ, Malhotra D, Shapiro JI. Effects of enhanced oxygen release from hemoglobin by RSR13 in an acute renal failure model. Kidney Int 2001; 60: 1407-14.
- Wahr JA, Gerber M, Venitz J, Baliga N. Allosteric modification of oxygen delivery by hemoglobin. Anesth Analg 2001; 92: 615-20.
May contain information that is not supported by performance and intended use claims of Radiometer's products. See also Legal info.
Acute care testing handbook
Get the acute care testing handbook
Your practical guide to critical parameters in acute care testing.
Download nowRelated webinar
Evolution of blood gas testing Part 1
Presented by Ellis Jacobs, PhD, Assoc. Professor of Pathology, NYU School of Medicine.
Watch the webinar


