Printed from acutecaretesting.org
January 2008
Measurement of circulating glucose: The problem of inconsistent sample and methodology
THE SAMPLE
Glucose concentration might be measured using a whole blood sample (either venous, arterial or capillary); or a plasma sample recovered after centrifugation of anticoagulated whole blood (either venous, arterial or capillary); or a serum sample recovered after centrifugation of non-anticoagulated whole blood (either venous, arterial or capillary).
There are then nine different sample types that could legitimately be used to measure circulating glucose concentration but for mainly logistical reasons, only five are routinely used.
They are: whole blood (venous, capillary and arterial) and plasma and serum samples recovered from venous blood.
The necessity of centrifugation determines that in general plasma and serum samples are only used in the laboratory.
Outside the laboratory whole blood is used. In the intensive care unit and emergency room this may be arterial or venous blood collected via an indwelling catheter or puncture of a vein or an artery, whereas in all other point-of-care settings it is more often capillary whole blood, collected by finger, earlobe or heel stab.
When, as is often the case, the term blood glucose concentration is used without qualification of sample type, an erroneous assumption is implied that sample type does not affect glucose concentration.
In fact, for accurate interpretation of glucose results, it is important that the sample type be known. The most significant systematic difference is between whole blood glucose concentration and plasma or serum glucose concentration.
Difference between whole blood and plasma/serum glucose concentration
To understand this difference, which is of the order 10-15 % [1], it is necessary to look in a little detail at the way glucose in blood is distributed between plasma and the cytoplasm of blood cells.
Because they are quantitatively by far the most significant, it is only the red blood cells (erythrocytes) that are important for this discussion.
The red cell membrane is effectively freely permeable to glucose, so that glucose passes from plasma to red cell cytoplasm, as well as in the reverse direction, maintaining equal concentrations on either side of the membrane.
But the measured glucose is present only in the aqueous (water) phase of both plasma and red cell cytoplasm, and crucially for this discussion, the water content of plasma is significantly greater than the water content of red cells.
So that, although the glucose concentration in plasma water is the same as that in red cell water, the different water contents determine that glucose concentration of plasma and red cell are unequal.
The magnitude of that inequality can be defined by the percentage difference in water content. The solid phase of plasma (principally lipids and proteins) occupies around 7 % of plasma volume so that the water content of plasma is approximately 93 % [2]. The solid phase of red cells, due almost entirely to hemoglobin, occupies around 29 % of red cell cytoplasm volume and thus the water content of red cells is approximately 71 % [3].
Since glucose concentrations in plasma water and red cell water are the same, but water cell contents differ by (93 - 71/93) x 100 i.e. 23.6 %, it follows that the glucose concentration of plasma and red cell also differs by 23.6 % (plasma greater than red cell).
Whole blood glucose concentration is determined by three parameters:
- plasma glucose concentration, pl gluc;
- red cell glucose concentration, rc gluc (approximately 23.6 % less than plasma concentration), and
- % of whole blood volume that is occupied by red cells (this is the packed cell volume (PCV) or hematocrit (Ht)).
Thus, if plasma glucose concentration is 10.0 mmol/L (182mg/dL), then red cell glucose concentration is 23.6 % less (10.0 - 2.36) i.e. 7.6 mmol/L (142mg/dL), and whole blood glucose is (0.45 x 7.6) + (0.55 x 10.0) i.e. 8.9 mmol/L (162 mg/dL).
TABLE 1 describes how hematocrit affects whole blood glucose concentration and therefore the percentage difference in glucose concentration of plasma and whole blood. If hematocrit is at the midpoint of the reference range i.e. 45 %, the theoretical difference is 11 %, but less if hematocrit is reduced and more than 11 % if hematocrit is raised.
Importantly, it should be noted that unlike whole blood glucose concentration, plasma glucose concentration is unaffected by hematocrit.
TABLE 1:
Effect of hematocrit (Hct) on whole blood glucose concentration
| PLASMA GLUCOSE (mmol/L) |
RED CELL GLUCOSE (mmol/L) |
WHOLE BLOOD GLUCOSE (mmol/L) |
||
| Hct 30 % (0.3 x 7.6) + (0.70 x (10.0) |
Hct 45 % (0.45 x 7.6) + (0.55 x (10.0) |
Hct 60 % (0.60 x 7.6) + (0.40 x (10.0) |
||
| 10.0 | 7.6 | 9.28 | 8.92 | 8.50 |
|
% difference |
7.2 | 10.8 | 14.4 | |
Difference between venous, capillary and arterial whole blood
Normal physiology, specifically the rate at which glucose is extracted from blood by tissues, determines that in the postprandial (non-fasting) state, capillary (whole) blood glucose is slightly higher than venous (whole) blood.
A representative study of 75 healthy adults submitted for glucose tolerance testing revealed mean venous blood glucose at 30 mins post glucose load was 6.69 mmol/L compared with 8.06 mmol/L for capillary blood, a difference of 1.37 mmol/L (24.9 mg/dL).
The difference at 60, 90, 120 and 180 mins post glucose was 1.40, 1.07, 0.95 and 0.52 mmol/L respectively [4]. The ratio of whole capillary blood glucose concentration to whole venous blood glucose concentration in the non-fasting state is estimated to be in the range 1.09 to 1.24 [4,5].
In the fasting state glucose concentration of venous blood is not significantly different from that that of capillary blood [4]. Arterial blood glucose concentration approximates closely to capillary blood glucose concentration.
Difference between venous plasma and venous serum glucose concentration
The glucose concentration of venous plasma and venous serum should theoretically be the same. Any difference is an artifact due to sample handling; specifically delay in separating serum or plasma from cells.
Delay causes lowering of glucose concentration at an estimated rate of 5-7 % per hour, due to continued metabolism of glucose (glycolysis) by blood cells [6].
This in vitro glycolysis is prevented or at least minimized in the case of plasma by addition of sodium fluoride to the anticoagulant present in blood collection tubes [6].
If serum glucose is to be measured, blood must be centrifuged and serum analyzed within an hour of collection, in which case the result should theoretically be the same as that from an equivalent plasma sample derived from anticoagulated bloocontaining a glucose preservative such as sodium fluoride.
A recent study [7] however demonstrated a slight (4.7 %) negative bias in plasma glucose from blood collected into tube containing sodium fluoride compared with serum glucose when serum was separated from cells very soon (15 minutes) after collection.
This confirms that sodium fluoride cannot be relied upon to completely eliminate in vitro glycolysis, particularly during the first hour after blood collection [6].
FIGURE 1 describes the theoretical relationships of glucose concentration between the various sample types.
FIGURE 1:
Glucose concentration is sample dependent
(adapted from ref 4)
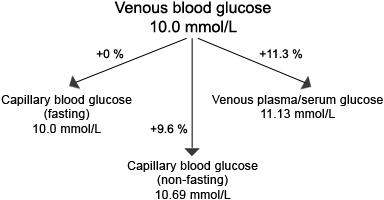
Note the the difference between capillary blood glucose and venous sample types depends on the time since last meal. Arterial blood glucose approximates closely to capillary blood glucose.
Venous plasma - the reference sample
Of all the clinical contexts in which glucose is measured, diagnosis of diabetes is the one that demands greatest accuracy and precision.
Because plasma and serum glucose concentration are unaffected by the confounding effect of hematocrit, they are a more accurate measure of circulating glucose than whole blood glucose concentration.
Compared with serum glucose, plasma glucose is considered less likely, in the context of routine clinical practice, to be affected by the potential inaccuracy associated with in vitro glycolysis.
Venous blood is more convenient and safer to collect than arterial blood, and is less prone to sampling error than capillary blood sampling.
Thus plasma, specifically venous plasma is the sample that affords greatest accuracy and convenience, and the one recommended for diagnosis of diabetes [8,9].
The consensus that plasma be regarded as the reference sample against which all other sample types be compared has led to the recommendation that if whole blood glucose concentration is measured, results should be converted to ‘equivalent plasma values’ using a constant factor 1.11 [10-12].
Plasma equivalent glucose (mmol/L or mg/dL) = whole blood glucose (mmol/L or mg/dL) x 1.11.
This factor is the theoretical ratio of plasma glucose concentration to whole blood glucose concentration derived from blood with normal hematocrit (43 %) and assumes, as in the discussion above, that water occupies 93 % of plasma volume and 71 % of red cell volume.
Adoption of this policy, which in essence means reporting all glucose results as plasma glucose concentration allows greater harmonization between central laboratory results and those obtained at the point of care [13,14].
The potential for errors in interpretation of glucose results, due to confusion or ignorance about the difference between whole blood and plasma glucose concentration, is much reduced by the policy.
However it must be remembered that plasma ‘equivalent’ values are as dependent on hematocrit as whole blood glucose concentration. So long as hematocrit does not deviate from normal then plasma equivalent glucose concentration is theoretically the same as measured plasma glucose concentration.
A decrease in hematocrit causes increase in plasma equivalent glucose concentration - relative to measured plasma glucose concentration - and vice versa. The magnitude of the increase and decrease is theoretically the same as that for the effect of hematocrit on whole blood glucose (see TABLE 1).
THE MEASUREMENT
To satisfy the need for glucose to be measured not only in the laboratory but also in a range of settings outside the laboratory, by personnel who have little or no analytical experience, a range of measuring technologies have emerged.
In the US alone there are at least eight manufacturers producing 34 different glucose meters for home or hospital point-of-care testing [15].
Almost all glucose measurements, both inside and outside the laboratory are based on the action of glucose on one of three enzymes: glucose hexokinase, glucose oxidase or glucose dehydrogenase.
However the way the sample is treated during the analytical process as well as the detection system used to monitor the reaction of glucose with these enzymes varies.
Hexokinase methods
In the central laboratory, glucose-measuring platforms on automated analyzers are most frequently based on the enzyme hexokinase [16].
Because of the high level of accuracy and precision that can be routinely achieved with automated hexokinase methods, many consider them an acceptable reference method, certainly suitable for diabetes diagnosis.
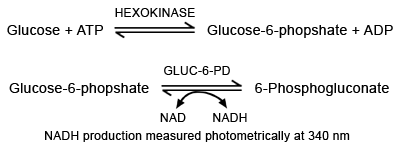
In the presence of adenosine triphosphate (ATP), glucose is phosphorylated by hexokinase to glucose 6 phosphate (FIGURE 2a). This is then oxidized to 6-phosphogluconate by a second enzyme glucose-6-phosphate dehydrogenase.
This second reaction depends on the concurrent reduction of co-factor nicotinamide adenine dinucleotide (NAD+) to NADH or nicotinamide dinucleotide phosphate (NADP+) to NADPH (depending on the source of hexokinase).
The rate of utilization of NAD(P) or production of NAD(P)H can be easily monitored photometrically at 340 or 365 nm and is proportional to glucose concentration in the specimen.
FIGURE 2a:
Glucose measurement - hexokinase
Glucose oxidase - photometric and amperometric
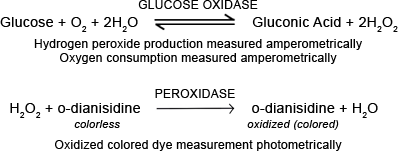
Both laboratory-based and point-of-care glucose measuring systems utilize the enzyme glucose oxidase. This enzyme catalyzes the oxidation of glucose to gluconic acid and hydrogen peroxide (FIGURE 2b).
The reaction can be monitored photometrically or amperometrically. For photometric assays, the system includes a second enzyme, peroxidase and one of a number of chromogenic oxygen acceptors.
In the presence of peroxidase, hydrogen peroxide formed from the action of glucose oxidase is split providing the oxygen required to transform a colorless oxygen acceptor (e.g. dianisidine) to its colored, oxidized form.
The intensity of the color (measured photometrically) is directly proportional to glucose concentration. This kind of reaction has been adapted for both automated measurement in the laboratory as well as for point-of-care test strips/glucose (reflectance) meters.
These test strips are comprised of several layers, the top-most layer functioning to separate red cells from plasma, so that although whole blood is applied, it is only the glucose in plasma that filters through to the analysis layer and measured.
FIGURE 2b:
Glucose measurement - glucose oxidase
The consumption of oxygen or production of hydrogen peroxide that results from glucose oxidase action allows amperometric measurement of glucose. The Yellow Springs glucose analyzer, which continues to be used in clinical laboratories, was the first to exploit this methodology more than 30 years ago [17].
Glucose oxidase is immobilized on the membrane of the measuring oxygen electrode contained in this instrument.
Hydrogen peroxide, formed when glucose (in the sample) comes in contact with the glucose oxidase membrane, diffuses across a second membrane and is oxidized at the platinum electrode.
The current generated is proportional to the glucose concentration. The Analox glucose analyzer also measures the effect of glucose oxidase amperometrically, but in this case the oxygen electrode measures the consumption of oxygen directly.
In both of these instruments the analytical process necessitates pre-dilution of the sample to achieve linearity across the concentration range, so that a diluted sample is presented to the electrode.
By contrast the glucose-measuring electrode present in blood gas and some other point-of-care analyzers allows glucose measurement directly on an undiluted sample.
An important difference between these so-called ‘direct reading’ glucose electrodes and all other glucose measuring systems is that they respond to the glucose in the water of the specimen and measure glucose molality (amount of glucose per kilogram of water, mmol/kg H2O) [18], rather than molarity (amount of glucose per liter of sample, mmol/L).
As the red cell membrane is freely permeable to glucose, plasma and red cell glucose molality are the same, so that the unmodified results from ‘direct reading’ electrode instruments are the same whether plasma or whole blood is used for analysis and results are unaffected by hematocrit.
Although molality is equal to activity and therefore the more physiologically relevant measure of circulating glucose concentration [19], the convention that circulating glucose be measured and reported in terms of glucose concentration of the whole specimen (mmol/L) demands that the measured molality results from direct reading biosensors be converted to molarity for reporting.
The conversion factor used takes account of the water content of the sample, which for normal plasma is approximately 0.93 kg/L and for whole blood is 0.84 kg/L.
If such a water correction factor is applied to the results obtained from a direct reading electrode reported results agree much more closely with those obtained using an indirect electrode measuring system [19].
In the absence of water correction an approximate difference of 18 % for whole blood and 6 % for plasma glucose is to be expected; direct reading greater than indirect reading electrode.
The miniaturization of electrodes has allowed the development of test strips that incorporate the glucose oxidase/oxygen electrode measuring system. This newer technology is challenging the photometric technology that has previously been the basis for point-of-care glucose test strips. As is the case with older test strips, whole blood is applied to the strip but plasma glucose is measured.
Glucose dehydrogenase - the HemoCue analyzer
Glucose measuring systems based on glucose dehydrogenase are fewer in number than those based on glucose oxidase or hexokinase but the HemoCue glucose analyzer is an example of one that does.
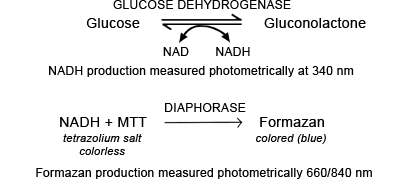
Glucose dehydrogenase enables the oxidation of glucose to gluconolactone during which NAD is reduced NADH (FIGURE 2c). In the HemoCue system the NADH formed reacts with tetrazolium salt MTT, to form a blue colored compound formazan.
This reaction is catalyzed by a second enzyme, diaphorase. The production of formazan, which is proportional to the glucose concentration of the sample, is monitored photometrically at two wavelengths 660 and 840 nm. The analytical cycle includes hemolysis of red cells prior to measurement.
FIGURE 2c:
Glucose measurement - glucose dehydrogenase
In summary glucose measuring systems differ in many ways. Samples may be diluted, undiluted or hemolysed prior to measurement. Although all are based on one of three enzymes, fundamentally different measuring systems (photometry, reflectance spectrometry, and electrochemistry) are employed.
Manufacturers of test-strips pre-calibrate their instruments using any one of several different ‘reference’ methodologies.
There is thus lack of consistency in calibration. Although whole blood may be the sample applied to the system, in some cases it is actually plasma glucose concentration that is measured and/or reported.
Any of these variables may account, at least in part, for observed differences in circulating glucose concentration when comparing measuring systems.
THE PATIENT
Patient characteristics, outside of circulating glucose concentration, can affect glucose results. Mention has already been made of the variable effect that hematocrit has on whole blood glucose concentration.
This effect determines that a severely anaemic patient with a low hematocrit (< 30 %) will have a falsely elevated whole blood glucose concentration that might mask hypoglycemia, whereas a patient with polycythemia and marked increase in hematocrit (> 60 %) will have a falsely reduced whole blood glucose concentration.
The magnitude of the effect of hematocrit is method dependent, so that some measuring systems (e.g. HemoCue, ‘direct reading’ glucose electrodes) are virtually unaffected by hematocrit [20], whereas others (Yellow Springs analyzer, some test strips) are associated with significant changes in blood glucose concentration due to abnormal hematocrit [21].
Some point-of-care glucose methods that depend on the enzyme glucose oxidase are sensitive to marked changes in oxygen tension [22]. Glucose may be underestimated by up to 15 % in patients receiving oxygen therapy who have high pO2 (> 13 kPa, 100 mmHg).
This underestimate is more likely if arterial or capillary blood, rather than venous blood is used for analysis.
Severe hypotension, hypovolemia and resulting hypoperfusion, as is often seen in shocked critically ill patients, can cause gross inaccuracy in glucose measurement if capillary blood rather than venous or arterial blood are used for analysis [23,24].
Some have argued that capillary blood testing is so unreliable in the critical care setting that only venous or arterial blood should be used for glucose testing in intensive care units where intensive insulin therapy is part of standard care.
SUMMARY
Circulating glucose concentration can be assessed using a range of samples and variable technology. For the most accurate interpretation of individual patient results, due consideration should be given to the significance of these differences.
In addition it is important to be aware that clinical features unique to the patient may also affect measured glucose. Of the many factors that might confound interpretation of patient results, the difference between whole blood and plasma glucose concentration is probably the most significant, so the decision by the IFCC to recommend reporting all glucose results, irrespective of sample type or measuring system, as plasma glucose concentration [12] is to be welcomed.
Implementation will do much to harmonize glucose testing and should prevent many of the most serious errors of interpretation.
Investigation of discordance between glucose results obtained at the point of care with results obtained in the central laboratory must take account of sample type, detail of measuring systems, characteristics of the patient and possible ways in which each of these three elements might interact to affect glucose result.
References+ View more
- Ravel R. Tests for Diabetes and hypoglycemia. In: Clinical laboratory Medicine (6th Ed). St Louis, Missouri: Mosby, 1995: 454.
- Faye S, Payne R. Rapid Measurement of serum water to assess pseudohyponatremia. Clin Chem 1986; 32: 983-86.
- Kessler E, Levy M, Allen R. Red cell electrolytes in patients with edema. J Lab Clin Med 1961; 57: 32-41.
- Kuawa K, Nakayama T, Hoshino T et al. Relationship of glucose concentration in capillary whole blood, venous whole blood and venous plasma. Clin Chim Acta 2001; 307: 187-92.
- Haekel R, Brink U, Colic D et al. Comparability of blood glucose concentrations measured in different sampling systems for detecting glucose intolerance. Clin Chem 2002; 48: 936-39.
- Chan A, Swaminathan R, Cockram C. Effectiveness of sodium fluoride as a preservative of glucose in blood. Clin Chem 1989; 35: 315-17.
- Waring S, Evans LE, Kirkpatrick CT. Glycolysis inhibitors negatively bias blood glucose measurements: potential impact on the reported prevalence of diabetes mellitus. J Clin Pathol 2007; 60: 820-23.
- Sacks D, Bruns D, Goldstein D et al. Guidelines and recommendations for laboratory analysis and management of diabetes mellitus. Clin Chem 2002; 48: 436-72.
- American Diabetes Association (ADA). Diagnosis and classification of diabetes. Diabetes Care 2005; 28: 28: S37-42.
- D’Orazio, P Burnett R, Fogh-Anderson N et al. Approved IFCC recommendation on reporting results for blood glucose (abbreviated). Clin Chem 2005; 51: 1573-76.
- Steffes M, Sacks D. Measurement of circulating glucose concentrations: The time is now for consistency among methods and types of samples. Clin Chem 2005; 51: 1569-70.
- D’Orazio P, Burnett R Fogh-Anderson N et al. Approved IFCC recommendation on reporting results for blood glucose. Clin Chem Lab Med 2006; 44: 1486-89.
- Savoca R Jaworek B, Huber A. New “plasma referenced” POCT glucose monitoring systems - are they suitable for glucose monitoring and diagnosis of diabetes? Clin Chim Acta 2006; 372: 199-01.
- Fogh-Anderson N. Evaluation of HemoCue Glucose meter (201+): converting B-glucose to P-glucose. Point of Care 2004; 3:172-75.
- Sluss P. Bedside blood glucose testing systems: current technology Point of Care 2006; 5: 121-25.
- Twomey P. Plasma glucose measurement with the Yellow Springs Glucose 2300 STAT and the Olympus AU640. J Clin Pathol 2004; 57: 752-54.
- D’Orazio P. Biosensors in clinical chemistry. Clin Cim Acta 2003; 334: 41-69.
- Fogh-Anderson N, Wimberley, P Thode J et al. Direct reading glucose electrodes detect molality of glucose in plasma and whole blood. Clin Chim Acta 1990; 189: 33-38.
- Fogh-Anderson N, Orazio P. Proposal for standardizing direct-reading biosensors for blood glucose. Clin Chem 1998; 44: 655-59
- Weiner K. An assessment of the effect of haematocrit on the HemoCue blood glucose analyzer. Ann Clin Biochem 1993; 30: 90-93.
- Tang Z, Lee JH, Louie RF et al. Effects of different hematocrit levels on glucose measurements with hand held meters for point of care testing. Arch Pathol Lab Med 2000; 124: 1135-40.
- Kilpatrick ES, Rumley AG, Smith AE. Variations in sample pH and pO2 affect ExachTech meter glucose measurements. Diabetic Med 1994; 11: 506-09.
- Atkin SH, Dasmahapatara A, Jaker M et al. Finger-stick glucose determination in shock. Ann Internal Med 1991; 114: 1020-24.
- Sylvan H, Pokorney M, English F. Accuracy of fingerstick glucose values in shock patients. Am J Crit Care 1995; 4: 44-48.
References
- Ravel R. Tests for Diabetes and hypoglycemia. In: Clinical laboratory Medicine (6th Ed). St Louis, Missouri: Mosby, 1995: 454.
- Faye S, Payne R. Rapid Measurement of serum water to assess pseudohyponatremia. Clin Chem 1986; 32: 983-86.
- Kessler E, Levy M, Allen R. Red cell electrolytes in patients with edema. J Lab Clin Med 1961; 57: 32-41.
- Kuawa K, Nakayama T, Hoshino T et al. Relationship of glucose concentration in capillary whole blood, venous whole blood and venous plasma. Clin Chim Acta 2001; 307: 187-92.
- Haekel R, Brink U, Colic D et al. Comparability of blood glucose concentrations measured in different sampling systems for detecting glucose intolerance. Clin Chem 2002; 48: 936-39.
- Chan A, Swaminathan R, Cockram C. Effectiveness of sodium fluoride as a preservative of glucose in blood. Clin Chem 1989; 35: 315-17.
- Waring S, Evans LE, Kirkpatrick CT. Glycolysis inhibitors negatively bias blood glucose measurements: potential impact on the reported prevalence of diabetes mellitus. J Clin Pathol 2007; 60: 820-23.
- Sacks D, Bruns D, Goldstein D et al. Guidelines and recommendations for laboratory analysis and management of diabetes mellitus. Clin Chem 2002; 48: 436-72.
- American Diabetes Association (ADA). Diagnosis and classification of diabetes. Diabetes Care 2005; 28: 28: S37-42.
- D’Orazio, P Burnett R, Fogh-Anderson N et al. Approved IFCC recommendation on reporting results for blood glucose (abbreviated). Clin Chem 2005; 51: 1573-76.
- Steffes M, Sacks D. Measurement of circulating glucose concentrations: The time is now for consistency among methods and types of samples. Clin Chem 2005; 51: 1569-70.
- D’Orazio P, Burnett R Fogh-Anderson N et al. Approved IFCC recommendation on reporting results for blood glucose. Clin Chem Lab Med 2006; 44: 1486-89.
- Savoca R Jaworek B, Huber A. New “plasma referenced” POCT glucose monitoring systems - are they suitable for glucose monitoring and diagnosis of diabetes? Clin Chim Acta 2006; 372: 199-01.
- Fogh-Anderson N. Evaluation of HemoCue Glucose meter (201+): converting B-glucose to P-glucose. Point of Care 2004; 3:172-75.
- Sluss P. Bedside blood glucose testing systems: current technology Point of Care 2006; 5: 121-25.
- Twomey P. Plasma glucose measurement with the Yellow Springs Glucose 2300 STAT and the Olympus AU640. J Clin Pathol 2004; 57: 752-54.
- D’Orazio P. Biosensors in clinical chemistry. Clin Cim Acta 2003; 334: 41-69.
- Fogh-Anderson N, Wimberley, P Thode J et al. Direct reading glucose electrodes detect molality of glucose in plasma and whole blood. Clin Chim Acta 1990; 189: 33-38.
- Fogh-Anderson N, Orazio P. Proposal for standardizing direct-reading biosensors for blood glucose. Clin Chem 1998; 44: 655-59
- Weiner K. An assessment of the effect of haematocrit on the HemoCue blood glucose analyzer. Ann Clin Biochem 1993; 30: 90-93.
- Tang Z, Lee JH, Louie RF et al. Effects of different hematocrit levels on glucose measurements with hand held meters for point of care testing. Arch Pathol Lab Med 2000; 124: 1135-40.
- Kilpatrick ES, Rumley AG, Smith AE. Variations in sample pH and pO2 affect ExachTech meter glucose measurements. Diabetic Med 1994; 11: 506-09.
- Atkin SH, Dasmahapatara A, Jaker M et al. Finger-stick glucose determination in shock. Ann Internal Med 1991; 114: 1020-24.
- Sylvan H, Pokorney M, English F. Accuracy of fingerstick glucose values in shock patients. Am J Crit Care 1995; 4: 44-48.
May contain information that is not supported by performance and intended use claims of Radiometer's products. See also Legal info.
Acute care testing handbook
Get the acute care testing handbook
Your practical guide to critical parameters in acute care testing.
Download nowScientific webinars
Check out the list of webinars
Radiometer and acutecaretesting.org present free educational webinars on topics surrounding acute care testing presented by international experts.
Go to webinars


