Printed from acutecaretesting.org
April 2018
Observation of clinically significant errors in oxygen saturation calculations when pO2 is low


Summary Calculation-based approaches to determining oxygen saturation, as used in some point-of-care tests, increasingly deviate from values measured directly by CO-oximetry as the partial pressure of oxygen in the blood decreases. Oxygen saturation should be measured by CO-oximetry when inaccuracies in calculations may negatively impact patient care.
Summarized from: Gunsolus IL et al. Low pO2 contributes to potential error in oxygen saturation calculations using a point of care assay. Am J Clin Pathol 2017; 149: 82-86.
Oxygen saturation (sO2) is routinely monitored to assess respiratory status and to calculate other indicators of cardiac and respiratory status, such as global oxygen demand. Three primary methods are used to determine sO2: pulse oximetry, CO-oximetry, and calculations.
Pulse oximetry is used for non-invasive, real-time monitoring of sO2, while both CO-oximetry and calculations are used to quantify sO2 in blood samples. Direct measurement of sO2 by CO-oximetry is performed by many blood gas analyzers, while calculation-based approaches using mathematical models that relate sO2 to other measured blood parameters are used in some point-of-care (POC) tests without CO-oximetry.
A 2014 acutecaretesting.org article by Chris Higgins asserted that sO2 is better measured by CO-oximetry than calculated, since direct measurements avoid errors that can arise from the physiologic assumptions made by calculated methods. As stated previously, these errors can be propagated through to parameters derived from sO2, such as global oxygen demand and Fick’s cardiac output [1-4].
While the proposed superiority of measured over calculated sO2 is based on sound analytical arguments, there has to date been limited evidence directly supporting this assertion. This article presents evidence of discordance between measured and calculated sO2 that is particularly pronounced when the partial pressure of oxygen (pO2) is low.
Index case spurs investigation
|
Time |
sO2 (%) |
Method |
|
12:27 |
37 |
CO-oximetry (measured) |
|
12:32 |
55 |
POC (calculated) |
|
13:23 |
39 |
CO-oximetry (measured) |
|
13:24 |
59 |
POC (calculated) |
TABLE I: sO2 values measured by CO-oximetry or calculated by a POC device during a catheterization procedure.
Comparing measured and calculated sO2
We began to investigate the source of this discrepancy by comparing measured and calculated sO2 across many patients. We first accessed 3323 archived sO2 values from our laboratory’s CO-oximeter in 1180 patients. We then used the mathematical model employed by our institution’s POC test (Equation 1) to calculate the sO2 that would be reported by the POC test for each patient. The necessary inputs to this equation (pO2, pH, and bicarbonate concentration, the latter derived from pCO2) were measured by the CO-oximeter simultaneously with sO2 and so were available in the instrument archives.
Equation 1:
$$\textit{s}o_2 = {x^3 +150x \ \over x^3+150x+23400},$$
Using this procedure, we obtained paired values of measured and calculated sO2 for each patient. We then calculated the percent difference between these paired values to assess the expected agreement between the CO-oximeter and the POC test.
To assess the validity of our approach, we applied it to the index case in which sO2 was measured using both CO-oximeter and POC testing at approximately the same time. We calculated that the POC test would report an sO2 of 48 %, compared to the value of 55 % that was observed. This demonstrates that our approach provides a reasonable estimate of the agreement between the CO-oximeter and the POC test.
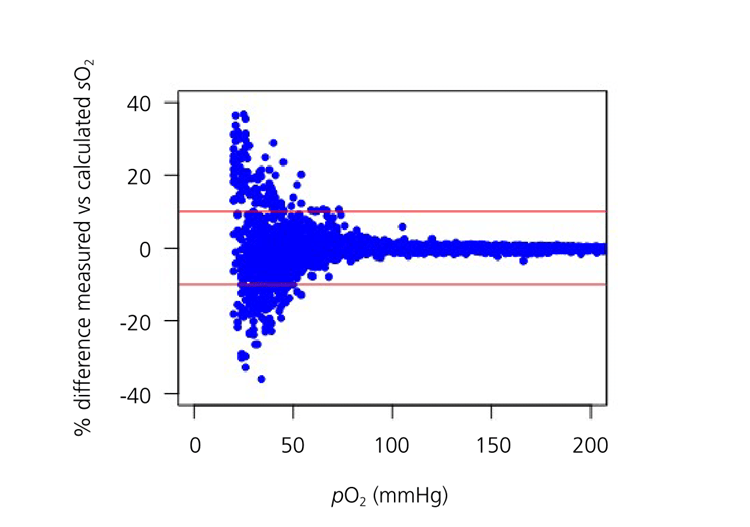
The results of our analysis showed that 8 % of calculated sO2 values were ≥10 % different from their paired measured value; we refer to these cases as discrepant. Over- and underestimation of the measured value occurred with approximately equal frequency. Notably, the majority of discrepant cases (94 %) occurred when pO2 was less than 50 mmHg. As shown in Fig. 1, the frequency of discrepancies between measured and calculated sO2 increased with decreasing pO2.
The frequency of discrepancies did not depend significantly on either the pH or bicarbonate concentration. However, the distribution of pH and bicarbonate concentration did shift to lower values in discrepant vs. non-discrepant cases.
The frequency of pH ≤7.4 was 16 % higher in discrepant cases than in non-discrepant cases, and the frequency of bicarbonate concentration ≤25 mEq/L was 3 % higher. These results suggest that discrepancies between measured and calculated sO2 are more likely in patients whose blood parameters deviate significantly from normal, particularly when pO2 is less than 50 mmHg.
Potential source of discrepancies
Precedent studies using smaller sample sets have also observed deviations of sO2 calculations from measured values under some conditions. One study observed consistently lower calculated than measured sO2 values in hypoxic blood samples, where pO2 was set to 10 or 20 mmHg using tonometry [5]. Another study showed that calculated sO2 values in 21 critically ill patients increasingly diverged from measured values with decreasing pO2 [1].
Using measured and calculated sO2 in clinical practice
References+ View more
- Woda RP, Dzwonczyk RD, Orlowski JP et al. Effect of measurement error on calculated variables of oxygen transport. J Appl Physiol 1996; 80: 559-63.
- Myburgh JA. Derived oxygen saturations are not clinically useful for the calculation of oxygen consumption. Anaesth Intensive Care 1992; 20: 460-63.
- Johnson PA, Bihari DJ, Raper RF et al. A comparison between direct and calculated oxygen saturation in intensive care. Anaesth Intensive Care 1993; 21: 72-75.
- Hess D, Elser RC, Agarwal NN. The effects on the pulmonary shunt value of using measured versus calculated hemoglobin oxygen saturation and of correcting for the presence of carboxyhemoglobin and methemoglobin. Respir Care 1984; 29: 1001-05.
- Porath M, Sinha P, Dudenhausen JW et al. Systematic instrumental errors between oxygen saturation analysers in fetal blood during deep hypoxemia. Clin Chim Acta 2001; 307: 151-57.
- Gøthgen IH, Siggaard-Andersen O, Kokholm G. Variations in the hemoglobin-oxygen dissociation curve in 10079 arterial blood samples. Scand J Clin Lab Investig Suppl 1990; 203: 87-90.
References
- Woda RP, Dzwonczyk RD, Orlowski JP et al. Effect of measurement error on calculated variables of oxygen transport. J Appl Physiol 1996; 80: 559-63.
- Myburgh JA. Derived oxygen saturations are not clinically useful for the calculation of oxygen consumption. Anaesth Intensive Care 1992; 20: 460-63.
- Johnson PA, Bihari DJ, Raper RF et al. A comparison between direct and calculated oxygen saturation in intensive care. Anaesth Intensive Care 1993; 21: 72-75.
- Hess D, Elser RC, Agarwal NN. The effects on the pulmonary shunt value of using measured versus calculated hemoglobin oxygen saturation and of correcting for the presence of carboxyhemoglobin and methemoglobin. Respir Care 1984; 29: 1001-05.
- Porath M, Sinha P, Dudenhausen JW et al. Systematic instrumental errors between oxygen saturation analysers in fetal blood during deep hypoxemia. Clin Chim Acta 2001; 307: 151-57.
- Gøthgen IH, Siggaard-Andersen O, Kokholm G. Variations in the hemoglobin-oxygen dissociation curve in 10079 arterial blood samples. Scand J Clin Lab Investig Suppl 1990; 203: 87-90.
May contain information that is not supported by performance and intended use claims of Radiometer's products. See also Legal info.


Acute care testing handbook
Get the acute care testing handbook
Your practical guide to critical parameters in acute care testing.
Download now
Scientific webinars
Check out the list of webinars
Radiometer and acutecaretesting.org present free educational webinars on topics surrounding acute care testing presented by international experts.
Go to webinars