Printed from acutecaretesting.org
July 2015
Comparing D-dimer assays using likelihood ratios and Fagan nomograms


GLOSSARY AND ABBREVIATIONS
| Abbreviation/term | Meaning |
| DVT | Deep venous thrombosis |
| Fagan nomogram | Graphical tool for estimating how much the result of a diagnostic test changes the probability that a patient has a disease |
| FDA | The Food and Drug Administration, a federal agency of the United States Department of Health and Human Services |
| LR | Likelihood ratio; the ratio of the probability that a given test result occurs in an ill person to the probability that the same result occurs in a healthy person |
| LR+ | Likelihood ratio of a positive test result; the ratio of the probability that a positive test result occurs in an ill person to the probability that a positive result occurs in a healthy person |
| LR– | Likelihood ratio of a negative test result; the ratio of the probability that a negative test result occurs in an ill person to the probability that a negative result occurs in a healthy person |
| NPV | Negative predictive value; fraction of test negatives who do not have disease |
| PE | Pulmonary embolism |
| Posttest probability | The probability that a patient has a disease after the result of a diagnostic test has become available |
| Pretest probability | The probability that a patient has a disease before the result of a diagnostic test has become available |
| Prevalence | Fraction of persons with disease in the tested population |
| Sens | Sensitivity; fraction of persons with disease characterized as ill with the test in question |
| Spec | Specificity; fraction of persons without disease characterized as healthy with the test in question |
| Spectrum of disease | The range of disease states found in the patient population upon which the test is to be used |
| VTE |
Venous thromboembolism (includes DVT and PE) |
BACKGROUND
When D-dimer assays are compared, the comparison is often based on data in literature. In this context literature includes articles in peer-reviewed journals and the information given in FDA decision summaries [2] and in manufacturer’s inserts.
The performance data that can be found here are most often sensitivity, specificity and the negative predictive value (NPV).
As D-dimer assays are used as an aid in diagnosis to rule out venous thromboembolism (VTE) – i.e. deep venous thrombosis (DVT) and pulmonary embolism (PE) – in patients with a low or moderate risk score for VTE, focus is especially on the negative predictive value, because the physicians want to be confident that the patients they rule out do not suffer from VTE.
However, the prevalence of disease has an influence on the negative predictive value, which tells us the percent of all with a negative test that are not ill.
Therefore it would be an advantage if negative predictive values were presented with information about the specific prevalence they were calculated for, i.e.
“NPV is 98 % at prevalence 7 %”. Figure 1 shows how NPV is influenced by the prevalence of disease and in addition it shows the influence that assay sensitivity also has. The influence of sensitivity is due to the increasing number of false-negative results that is the consequence of lowering the sensitivity.
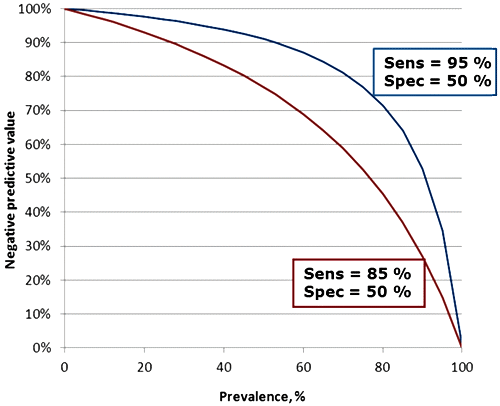
FIG. 1: Influence of prevalence and sensitivity on the negative predictive value. Assay specificity in both cases is 50 %.
Instead of comparing negative predictive values, likelihood ratios can be compared. Likelihood ratios have the advantage over negative predictive values that they do not depend on the prevalence of the disease.
LIKELIHOOD RATIOS
The likelihood ratio (LR) is the ratio of two probabilities:- The probability that a given test result occurs in an ill person
- The probability that the same result occurs in a healthy person
The likelihood ratio of a positive test (LR+) result is the ratio of the probability that a positive test result occurs in an ill person to the probability that a positive result occurs in a healthy person. Thus it tells us how many times it is more likely to observe a positive test result in an ill than in a healthy person. It is calculated as:
(LR+) = sensitivity / (1 – specificity)
The likelihood ratio of a negative test result (LR–) is the ratio of the probability that a negative test result occurs in an ill person to the probability that a negative result occurs in a healthy person. Thus it tells us how many times less likely it is to observe a negative test result in an ill than in a healthy person. It is calculated as:
(LR–) = (1 – sensitivity) / specificity
Diagnostic tests are ordered based on the initial assessment of the likelihood of disease (i.e. the pretest probability, which is the probability that a patient has a disease before the test result has become available).
The result of the diagnostic test will help us shift our suspicion one way or the other, and then determine the final probability of disease (the posttest probability, which is the probability that a patient has a disease after the test result has become available).
Likelihood ratios tell us how much we should shift our suspicion for a particular test result.
Table I shows the interpretation of likelihood ratios. An LR > 1 produces a posttest probability which is higher than the pretest probability. An LR < 1 produces a posttest probability which is lower than the pretest probability. If LR = 1, the test does not change the probability, whatsoever.
| LR | Interpretation |
| > 10 | Large and often conclusive increase in the likelihood of disease |
| 5-10 | Moderate increase in the likelihood of disease |
| 2-5 | Small increase in the likelihood of disease |
| 1-2 | Minimal increase in the likelihood of disease |
| 1 | No change in the likelihood of disease |
| 0.5-1.0 | Minimal decrease in the likelihood of disease |
| 0.2-0.5 | Small decrease in the likelihood of disease |
| 0.1-0.2 | Moderate decrease in the likelihood of disease |
| < 0.1 | Large and often conclusive decrease in the likelihood of disease |
TABLE I: Interpretation of likelihood ratios
USING LIKELIHOOD RATIOS – SOME EXAMPLES
Likelihood ratios depend as seen on the clinical sensitivity and clinical specificity of an assay. The ability of a test to correctly identify patients with and without a specific disease should not vary between patients.
However, it has to be kept in mind that the spectrum of disease found among patients used in a study can have an influence on the clinical performance of the test [3].
If we assume no major differences between patients in compared studies, likelihood ratios are ideal to directly compare two assays. As D-dimer tests are used to rule out VTE in patients with a sufficiently low pretest probability of VTE, we will focus on the negative likelihood ratio (LR–) in the following sections.
Likelihood ratios are considered useful measures of diagnostic accuracy because they can be used to estimate posttest probabilities. When we have the pretest probability, the test result and the likelihood ratio of the test, we may find the posttest probability by using the so-called Fagan nomogram [1].
To use the Fagan nomogram we need to know the pretest probability, which is the prevalence of disease for the patient group tested. We also need to know the likelihood ratio.
When we draw a line connecting the pretest probability and the likelihood ratio and extend the line until it intersects with the posttest probability axis, then the point of intersection is the posttest probability.
Posttest probability is thus the updated probability of a disease in a patient with a specific test result.
Alternatively the posttest probability may be calculated using an Excel sheet or one of the freely available calculators on the Internet.
The pretest determination is based on clinical information and algorithms. There are several scoring templates available. The Wells score (Table II and Table III) is often used. The original scorings included three levels: ”low”, ”moderate” or ”high” probability [4]. The scorings have been simplified to include two levels: ”unlikely” or ”likely” [5].
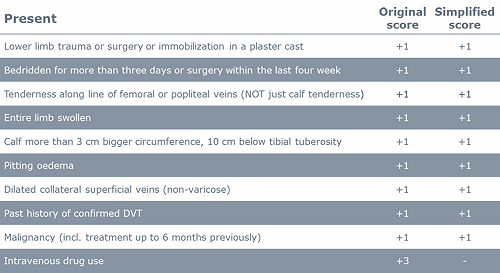
TABLE II: Wells score for DVT [4, 5]
| Original score | Risk | Simplified score | Risk |
| ≤ 0 | low | ≤ 1 | DVT unlikely |
| 1 or 2 | moderate | ≥ 2 | DVT likely |
| ≥ 3 | high |
TABLE III: Interpretation of the Wells score for DVT [4, 5]
The prevalence of DVT in the different risk groups will depend on the actual population tested and may differ a little from site to site. The guideline for diagnosing DVT from the American College of Chest Physicians [6] estimates that the prevalence of DVT in the ”low”-risk group is ~5.0 %, in the ”moderate”-risk group it is ~17 % and in the ”high”-risk group it is ~53 %.
As mentioned above the pretest probability is identical to the prevalence. Let us use these pretest probabilities for some hypothetical assays which we will call Assay 95/70, Assay 95/50, Assay 85/70 and Assay 85/50 and let us see how we can use them for comparison.
The performance of these hypothetical assays can be seen in Table IV.
| Assay | Sensitivity | Specificity | LR+ | LR– |
| Assay 95/70 | 95 % | 70 % | 3.2 | 0.07 |
| Assay 95/50 | 95 % | 50 % | 1.9 | 0.10 |
| Assay 85/70 | 85 % | 70 % | 2.8 | 0.21 |
| Assay 85/50 | 85 % | 50 % | 1.7 | 0.30 |
TABLE IV: Likelihood ratios for hypothetical assays
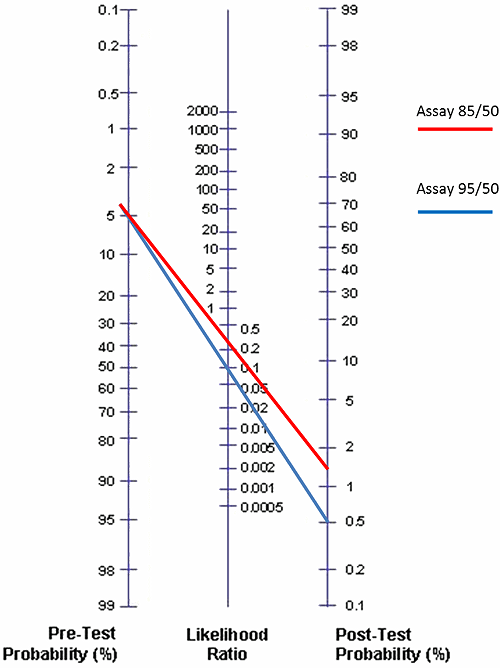
FIG. 2: Posttest probabilities for Assay 95/50 and Assay 85/50 given that the pretest probability is 5 % (low risk for DVT)
In Fig. 2 we have compared Assay 95/50 and Assay 85/50 using the Fagan nomogram and the prevalence of DVT as 5.0 % (the estimate for the ”low”-pretest-probability group by the American College of Chest Physicians) and the negative likelihood ratios 0.10 and 0.30, respectively.
We see that the posttest probabilities given a negative test are 0.5 % and 1.6 %, respectively. Now what does that mean?
It means that if we use Assay 95/50 for a low-risk patient group with a pretest probability of 5 % and get a negative result, then we know that the probability of the patient having DVT is only 0.5 %.
Therefore we can use the D-dimer results as a diagnostic aid to rule out DVT in these patients with a negative D-dimer result [4, 5, 6, 7].
If we instead use Assay 85/50 for a low-risk patient group with a pretest probability of 5 % and get a negative result, then we know that the probability of the patient having DVT is 1.6 %. This is still acceptable for ruling out DVT in the patients with a negative D-dimer result [4, 5, 6, 7].
How does all this compare to NPV? The NPV is the fraction of test negatives who do NOT have disease. As the posttest probability is the probability that a test-negative patient has DVT, it means that:
NPV = 100 % – posttest probability
Thus, when the posttest probability for Assay 95/50 is 0.5 %, it means that the NPV is 99.5 % (100 % – 0.5 %). The posttest probability for Assay 85/50 is 1.6 %. This corresponds to an NPV of 98.4 % (100 % – 1.6 %).
You can say that we have “normalized” the NPVs, which means that now we can compare the two assays, Assay 95/50 and Assay 85/50. The “normalized” NPVs are 99.5 % and 98.4 %, respectively.
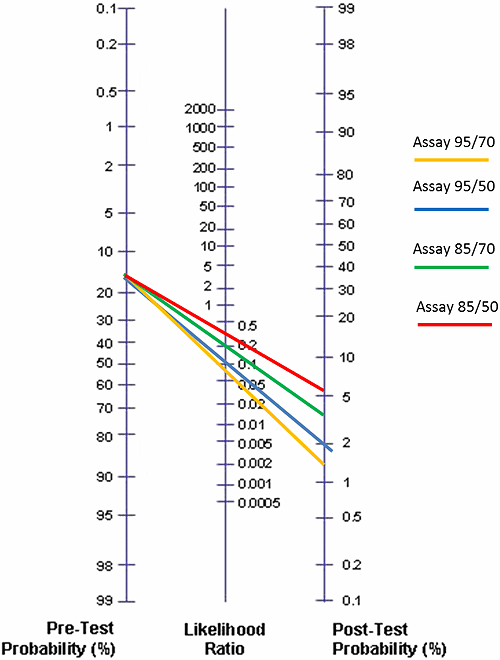
FIG. 3: Posttest probabilities for Assay 95/70, Assay 95/50, Assay 85/70 and Assay 85/50 given that the pretest probability is 17 % (moderate risk for DVT)
In Fig. 3 we have compared all the four hypothetical assays using the Fagan nomogram and the prevalence of DVT as 17 % (estimate for the ”moderate”-pretest-probability group by the American College of Chest Physicians). We get the results seen in the Table V.
| Assay | Posttest probability | Corresponding NPV |
| Assay 95/70 | 1.4 % | 98.6 % |
| Assay 95/50 | 2.0 % | 98.0 % |
| Assay 85/70 | 4.1 % | 95.9 % |
| Assay 85/50 | 5.8 % | 94.2 % |
TABLE V: Comparison of posttest probabilities and corresponding NPVs for Assay 95/70, Assay 95/50, Assay 85/70 and Assay 85/50 given that the pretest probability is 17 % (moderate risk for DVT)
We see that when the sensitivity is the same for two compared assays, higher specificity will give a lower posttest probability and a corresponding better NPV. We also see that when specificity is the same for two compared assays, higher sensitivity will give a lower posttest probability and a corresponding better NPV.
That might have been foreseen in advance. However, when two assays are compared, they usually do not have neither the same sensitivity nor the same specificity. In such a situation likelihood ratios and a Fagan nomogram can be extremely useful.
The FDA requirement for D-dimer assays as described in the CLSI document H59-A is: NPV ≥ 97 % [7]. When this requirement is achieved, 3 % or less of those who are dismissed based on a negative D-dimer result will be ill.
We can see in Fig. 3 and in Table V that only the assays with a sensitivity of 95 % will fulfill the FDA requirement for NPV when pretest probability is 17 % (~moderate risk). That is also why the guidelines for diagnosing DVT and PE group the D-dimer assays that can be used in diagnosis, into [8, 9]:
- Highly sensitive assays. Diagnostic sensitivity ≥ 95 %. Can be used to exclude DVT or PE in patients having a low or moderate pretest probability.
- Moderately sensitive assays. Diagnostic sensitivity < 95 %. Can be used to exclude DVT or PE in patients having a low pretest probability.
CONCLUSION
Likelihood ratios and Fagan nomograms are useful tools for comparing D-dimer assays. By using these tools, posttest probabilities and their corresponding “normalized” NPVs that can be found and used for direct assay performance comparisons.
This gives a more reliable comparison than a comparison of NPVs reported from various studies and separate sources.
Read more about d-dimer:
- Causes of increased D-dimer
- Age-adjustment of the D-dimer cut-off value to improve the exclusion of thromboembolic events in older patients
- The clinical use of a D-dimer assay
- Assessment of plasma D-dimer as a diagnostic and prognostic aid for abdominal aortic aneurysm
- D-dimer assays - pitfalls of analytical comparisons
- The role of D-dimer in diagnosis of venous thromboembolism – a review
References+ View more
- Fagan TJ. Nomogram for Bayes theorem [Letter]. N Engl J Med 1975; 293: 275
- FDA 510(k) Premarket Notification database – http://www.accessdata.fda.gov/scripts/cdrh/cfdocs/cfPMN/pmn.cfm (accessed June 2015)
- CLSI/NCCLS document EP12-A2 User Protocol for Evaluation of Qualitative Test Performance; Approved Guideline 2nd Edition. Vol. 28 No. 3. 2008
- Wells PS, Forgie MA. Diagnosis of deep vein thrombosis. Biomed Pharmacother 1996; 50,6-7: 235-42
- Venous thromboembolic diseases: the management of venous thromboembolic diseases and the role of thrombophilia testing. NICE guidelines [CG144] June 2012
- Bates SM, Jaeschke R, Stevens SM, Goodacre S, Wells PS, Stevenson MD, Kearon C, Schunemann HJ, Crowther M, Pauker SG, Makdissi R, Guyatt GH. American College of Chest Physicians: Diagnosis of DVT: Antithrombotic Therapy and Prevention of Thrombosis, 9th ed: American College of Chest Physicians Evidence-Based Clinical Practice Guidelines. Chest 2012; 141, 2 Suppl: e351S-418S
- CLSI. Quantitative D-dimer for the Exclusion of Venous Thromboembolic Disease; Approved Guideline. CLSI document H59-A. Wayne PA: Clinical and Laboratory Standards Institute; 2011
- Bates SM, Jaeschke R, Stevens SM, Goodacre S, Wells PS, Stevenson MD, Kearon C, Schunemann HJ, Crowther M, Pauker SG, Makdissi R, Guyatt GH. American College of Chest Physicians: Diagnosis of DVT: Antithrombotic Therapy and Prevention of Thrombosis, 9th ed: American College of Chest Physicians Evidence-Based Clinical Practice Guidelines. Chest 2012; 141, 2 Suppl: e351S-418
- Authors/Task Force Members, Konstantinides SV, Torbicki A, Agnelli G, Danchin N, Fitzmaurice D, Galiè N, Gibbs JS, Huisman MV, Humbert M, Kucher N, Lang I, Lankeit M, Lekakis J, Maack C, Mayer E, Meneveau N, Perrier A, Pruszczyk P, Rasmussen LH, Schindler TH, Svitil P, Vonk Noordegraaf A, Zamorano JL, Zompatori M; Authors/Task Force Members. 2014 ESC Guidelines on the diagnosis and management of acute pulmonary embolism: The Task Force for the Diagnosis and Management of Acute Pulmonary Embolism of the European Society of Cardiology (ESC) Endorsed by the European Respiratory Society (ERS). Eur Heart J 2014; 35,43: 3033-73
References
- Fagan TJ. Nomogram for Bayes theorem [Letter]. N Engl J Med 1975; 293: 275
- FDA 510(k) Premarket Notification database – http://www.accessdata.fda.gov/scripts/cdrh/cfdocs/cfPMN/pmn.cfm (accessed June 2015)
- CLSI/NCCLS document EP12-A2 User Protocol for Evaluation of Qualitative Test Performance; Approved Guideline 2nd Edition. Vol. 28 No. 3. 2008
- Wells PS, Forgie MA. Diagnosis of deep vein thrombosis. Biomed Pharmacother 1996; 50,6-7: 235-42
- Venous thromboembolic diseases: the management of venous thromboembolic diseases and the role of thrombophilia testing. NICE guidelines [CG144] June 2012
- Bates SM, Jaeschke R, Stevens SM, Goodacre S, Wells PS, Stevenson MD, Kearon C, Schunemann HJ, Crowther M, Pauker SG, Makdissi R, Guyatt GH. American College of Chest Physicians: Diagnosis of DVT: Antithrombotic Therapy and Prevention of Thrombosis, 9th ed: American College of Chest Physicians Evidence-Based Clinical Practice Guidelines. Chest 2012; 141, 2 Suppl: e351S-418S
- CLSI. Quantitative D-dimer for the Exclusion of Venous Thromboembolic Disease; Approved Guideline. CLSI document H59-A. Wayne PA: Clinical and Laboratory Standards Institute; 2011
- Bates SM, Jaeschke R, Stevens SM, Goodacre S, Wells PS, Stevenson MD, Kearon C, Schunemann HJ, Crowther M, Pauker SG, Makdissi R, Guyatt GH. American College of Chest Physicians: Diagnosis of DVT: Antithrombotic Therapy and Prevention of Thrombosis, 9th ed: American College of Chest Physicians Evidence-Based Clinical Practice Guidelines. Chest 2012; 141, 2 Suppl: e351S-418
- Authors/Task Force Members, Konstantinides SV, Torbicki A, Agnelli G, Danchin N, Fitzmaurice D, Galiè N, Gibbs JS, Huisman MV, Humbert M, Kucher N, Lang I, Lankeit M, Lekakis J, Maack C, Mayer E, Meneveau N, Perrier A, Pruszczyk P, Rasmussen LH, Schindler TH, Svitil P, Vonk Noordegraaf A, Zamorano JL, Zompatori M; Authors/Task Force Members. 2014 ESC Guidelines on the diagnosis and management of acute pulmonary embolism: The Task Force for the Diagnosis and Management of Acute Pulmonary Embolism of the European Society of Cardiology (ESC) Endorsed by the European Respiratory Society (ERS). Eur Heart J 2014; 35,43: 3033-73
May contain information that is not supported by performance and intended use claims of Radiometer's products. See also Legal info.


Register for the related webinar
The Benefit of Using a D-dimer Assay with a High Clinical Specificity
Presented by Karin Strandberg, MD, PhD, Assoc. Prof.
Join the webinar
Acute care testing handbook
Get the acute care testing handbook
Your practical guide to critical parameters in acute care testing.
Download now
Scientific webinars
Check out the list of webinars
Radiometer and acutecaretesting.org present free educational webinars on topics surrounding acute care testing presented by international experts.
Go to webinars