Printed from acutecaretesting.org
April 2006
I found the gap… it’s in the basement!
THE GAP IS IN THE BASEMENT?
OK, I am speaking metaphorically. But, here’s what I know about basements:
- The world’s most impressive buildings are built on them
- If they are faulty, buildings fall down and people get hurt
- We don’t often look there
- We store old stuff in them
- They are often not as neat and tidy as we would like
- Sometimes monsters live there
- The laboratory is often found there
- They are a long way from the ivory tower
How does this relate to laboratory quality?
- Laboratory quality management is built on a foundation of principles and assumptions
- If those assumptions are faulty, or the principles are poorly applied, patients get hurt
- We don’t often test the consistency and competence of quality management practices
- Most laboratories still use the 50-year-old quality control concept of ±2 SD
- When founding principles are tested, they are often found to be poorly understood, or even inherently flawed
- Speaking of monsters… perhaps the most fundamental founding assumption of laboratory quality control is that QC samples mirror changes in the patient samples. I recently tested that assumption and found that QC samples did not shift up and down with observed changes in the patient population
- The practice of laboratory quality management rests on a solid base of the front-line workers who make the daily decision to report or withhold patient results. If these people do not have appropriate procedures to follow and a sound understanding of the concepts of quality management, then patient results may be reported in error
- The sound concepts and principles postulated by experts in the ivory tower are seldom reflected in education of new front-line workers or in the practices of working laboratories
I agree with Yogi Berra: “In theory there is no difference between theory and practice. In practice there is.”
IN THEORY
Laboratory staff at all levels are competent to monitor method accuracy and precision in order to maintain analytical processes within performance standards defined to meet the needs of local patients and clinicians.
IN PRACTICE
“How do you know if method accuracy meets the needs of local patients and clinicians?”
Try this experiment in your laboratory. Select a quality control chart and ask all the people involved with monitoring the quality of that particular analyte (yes, all of them – from the tower to the basement!):
- Why are you monitoring this QC sample?
- Briefly explain the concept of accuracy
- What is the measured mean value of this sample at this time?
- What is the mean value assigned on the QC chart?
- What is the bias of this method at this time?
- Is the accuracy of this method acceptable?
- When and why would method accuracy change?
- If a change in accuracy did occur, how would you know?
- If a change in accuracy occurred, what would you do?
“How do you know if method precision meets the needs of local patients and clinicians?”
Using the same QC chart, continue to ask:
- Briefly explain the concept of precision
- What is the standard deviation (SD) of this sample at this time?
- What is the SD assigned on the QC chart?
- Is the precision of this method acceptable?
- What common events might cause a change in method precision?
- If a change in precision did occur, how would you know?
- If a change in precision occurred, what would you do?
What is OK?
I expect that at some time in this conversation you will hear “we run this QC sample to make sure that we are getting the right answer for patient samples.”
Continue to ask:
- What is the right answer for this QC sample?
- Where does that right answer come from?
- When and why would that right answer change?
- How close do the QC results have to be to the right answer for patient results to meet the needs of local patients and clinicians? (What are the acceptable limits?)
- Where do those acceptable limits come from?
- When and why would those limits change?
I find that the answers to these basic questions are usually surprisingly varied.
While most laboratorians can define accuracy in theory as agreement between the measured value and the true value, very few practice this by comparing measured means to a defined true value for QC samples.
Most front-line workers tell me that the mean on the QC chart is the right answer… unless that mean changes… then the new mean is the right answer… unless it changes…
Most people know that the SD and/or CV are used to monitor precision. However, standard deviations are frequently based on multiple data populations (mixed reagent lots), thus causing the calculated value to be 2-5 times larger than the current data set.
There appears to be a generally poor understanding of the fact that a standard deviation is a measured value that represents variation about the mean value of a single Gaussian data population.
Try picking some SD values from QC charts or monthly QC reports, and ask “What is the data set associated with this SD? Where did the data come from? Do the data show Gaussian distribution?” Examine the standard deviations on QC charts. I find that they are often assigned at many times their actual value, thus crippling the QC rules.
Regulatory bodies, professional associations, ISO guidelines and CLIA regulations clearly require that laboratories define performance standards or allowable error limits for each analytical procedure. Yet I find that performance standards are seldom clearly defined in practice.
IN THEORY
If a significant change occurs in an analytical process causing all patient samples to shift higher or lower, or to become more widely scattered, QC flags will immediately alert laboratory staff who will correct the problem before any bad patient reports are released.
IN PRACTICE
Try the following experiment with your staff or colleagues to test this founding assumption. Create a QC chart with 20 points showing normal, expected, random distribution, being sure that the assigned mean and SD reflect the observed data points. Then ask staff to plot 10 more results.
FIGURE 1 illustrates this exercise with a QC chart for potassium showing a shift in the mean from 5.20 mmol/L to 5.40 mmol/L beginning at run 23.
| Run # | Result # | Run # | Result # | Run # | Result # |
|
1 |
5.20 |
11 |
5.45 |
21 |
5.20 |
|
2 |
5.15 |
12 |
5.15 |
22 |
5.15 |
|
3 |
5.25 |
13 |
5.20 |
23 |
5.35 |
|
4 |
5.05 |
14 |
5.10 |
24 |
5.45 |
|
5 |
5.35 |
15 |
5.25 |
25 |
5.25 |
|
6 |
5.20 |
16 |
5.15 |
26 |
5.40 |
|
7 |
5.30 |
17 |
5.30 |
27 |
5.50 |
|
8 |
5.15 |
18 |
5.10 |
28 |
5.30 |
|
9 |
5.30 |
19 |
5.20 |
29 |
5.55 |
|
10 |
5.05 |
20 |
5.20 |
30 |
5.40 |
TABLE 1: Shows the data plotted in both Figure 1 and
Figure 2 (see figures below)
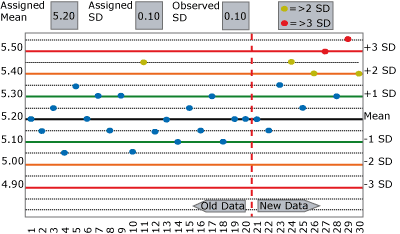
FIGURE 1
Ask your staff or colleagues:
- Does this chart show a change in accuracy?
a. If so, why do you think that? - Does this chart show a change in precision?
a. If so, why do you think that? - For each of the ten new results:
a. What QC rules are violated
b. What would you do?
Now use the same data as your original experiment, but assign the SD at double its actual value, as shown in FIGURE 2.
Perhaps divide the two examples between members of the group. Repeat your original questions and compare the results. Notice how much longer it takes to detect the change? Was the change detected at all?
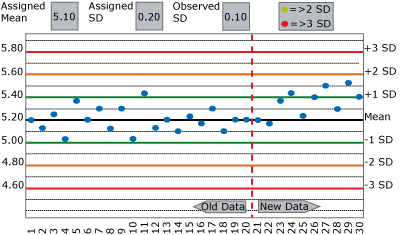
FIGURE 2
My experience with the above exercise often shows a worrisome gap in the ability to (a) recognize the type of change observed and (b) to take appropriate action in a timely manner.
When QC flags are seen, the most common response is to repeat the control and hope the next value happens to fall within acceptable limits. Change frequently goes undetected and unresolved for many runs.
Control results often appear to be within "acceptable limits" because those limits are not based on the actual mean and SD of the data population you wish to monitor. Standard deviations are often assigned on QC charts at many times their actual value, so QC rules fail to detect significant change.
IN THEORY
Obtaining quality control results within expected allowed ranges ensures the user that the patient results are acceptable.
IN PRACTICE
Obtaining quality control results within expected allowed ranges ensures the user that the patient results are acceptable ONLY IF the laboratory has:
- determined the right (true/target) value for each QC sample measured
- defined the maximum allowable variation (allowable error limit) from the true value for each control, based on maximum acceptable variation of patient results with the same concentration of analyte
- correctly calculated the mean and SD of the current QC sample population to assess current method bias and imprecision
- selected a quality control strategy (QC rules, frequency and number of QC samples, schedule for visual chart inspection, etc.) that is capable of detecting a change in method bias or precision that would cause the system to produce unacceptable patient results
- assigned the actual current calculated mean and SD values on QC charts
FIGURE 3 (A, B, C and D) shows four different scenarios for potassium quality control results. The green curve represents current method performance, and the burgundy curve shows a shift of +2 SD. This QC sample has a true/target value of 5.0 mmol/L based on the peer-group average, and this laboratory has set its allowable error limit at ±0.5 mmol/L.
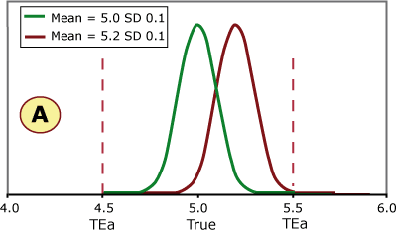
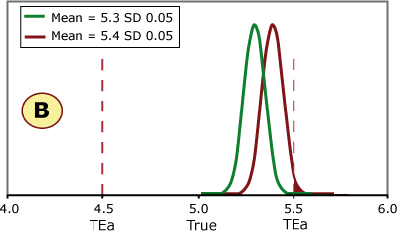
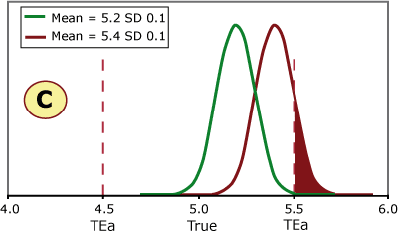
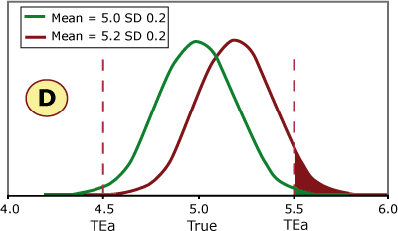
FIGURE 3 (A, B, C and D)
What do you think?
- Is it always necessary to detect a shift of 2 SD?
- Would your laboratory QC processes detect this shift?
Examples A and B can shift 2 SD without exceeding the allowable error limit, while a shift of 2 SD in examples C and D would cause unacceptable results to be reported.
Example C shows the same shift in the mean as seen on the QC charts in Figs. 1 and 2. This shift would cause a significant portion of results to exceed the allowable error limit of 0.05 mmol/L.
If this shift was undetected, a portion of patient samples with a true value of 5.0 mmol/L would be reported above 5.5 mmol/L. Would doctors react the same to a potassium of 5.0 mmol/L and 5.6 mmol/L in screening tests?
If a patient potassium result changed from 5.0 mmol/L to 5.6 mmol/L, would the doctor think the patient had experienced a significant biological change?
In the exercises in FIGURES 1 and 2 above, how quickly did your staff and colleagues detect the change?
When/did they stop reporting patient results to fix the problem? Or did they repeat, repeat and repeat in FIGURE 1, and not even notice the change in FIGURE 2?
You cannot detect significant changes in analytical performance unless you can define significant change. FIGURE 4 below illustrates how you can use "four cornerstones" to construct a solid foundation for quality control practices.
These solid cornerstones let you assess current method performance and determine the appropriate QC strategy to detect significant change.
The four cornerstones are:
- The best estimate of the True Value for a QC sample (the number you should get)
- The allowable error limit (maximum variation before results are unacceptable)
- The current actual/observed/measured mean value of a single Gaussian data set
- The current actual/observed/measured standard deviation of the same Gaussian data set
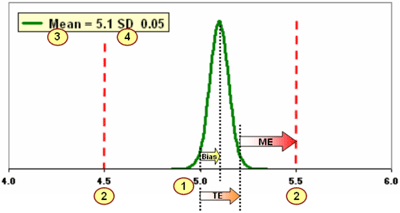
FIGURE 4
With this information you can calculate
- Bias (the average difference between measured values and the true value)
- Total Error (TE) (the total difference between measured values and the true value)
- Margin for Error (Total Allowable Error minus Total Error). The Margin for Error tells you how many SD the mean can shift before results will exceed allowable error limits. (This is one place where a big gap is a good thing!)
Once you know the size of shift you need to detect, then you can choose appropriate QC rules and strategies. I’ll talk more about that process in the next essay.
SUMMARY
My experience leads me to fear that the founding principles of laboratory quality management are often poorly understood, inadequately practiced and inherently flawed.
As I said, these are my observations, and I truly hope that many of you will stand up and prove me wrong. If you would like to discuss this essay, or test your quality savvy with online quizzes, log on to zoebrooksquality.com/moodle/.
References+ View more
- Yogi Berra Quotes www.brainyquote.com/quotes/authors/y/yogi_berra.html
- Fraser CG. Biological variation and quality for POCT. www.bloodgas.org, Quality assurance, Jun 2001
- Klee GG. Quality management of blood gas assays. www.bloodgas.org, Quality assurance, Jun 2001
- Westgard JO. Quality planning and control strategies. www.bloodgas.org, Quality assurance, Jun 2001
- Ehrmeyer SS. U.S. quality assurance regulations for decentralized testing. www.bloodgas.org, Point-of-care testing, Oct 2002
- Westgard JO. A six sigma primer. www.bloodgas.org, Quality assurance, Oct 2002
- Bais R. The use of capability index for running and monitoring quality control. www.bloodgas.org, Quality assurance, Jan 2003
- Kristensen HB. Proficiency testing versus QC-data comparison programs. www.bloodgas.org, Quality assurance, Oct 2003
- Thomas A. What is EQA - just another word for proficiency testing? www.bloodgas.org, Quality assurance, Jan 2004
- Ehrmeyer SS, Laessig RH. The new CLIA quality control regulations and blood gas testing. www.bloodgas.org, Quality assurance, Feb 2004
- Tonks DB. A study of the accuracy and precision of clinical chemistry determinations in 170 Canadian laboratories. Clin Chem 1963; 9: 217-23.
- Westgard JO, Quam EF, Barry PL. Selection grids for planning QC procedures. Clin Lab Sci 1990; 3: 271-78
- Fraser CG, Kallner A, Kenny D, Hyltoft Petersen P. Introduction: strategies to set global quality specifications in laboratory medicine. Scand J Clin Lab Invest 1999; 59: 477-78.
- Brooks, Z. Performance-driven quality control. AACC Press, Washington DC, 2001 ISBN 1-899883-54-9
- Brooks, Z. Quality Control – From Data to Decisions. Basic Concepts, Trouble Shooting, Designing QC Systems. Educational Courses. Zoe Brooks Quality Consulting. 2003
- Brooks Z, Plaut D, Begin C, Letourneau A. Critical systematic error supports use of varied QC rules in routine chemistry. AACC Poster San Francisco 2000
- Brooks Z, Massarella G. A computer programme that quickly and rapidly applies the principles of total error in daily quality management. Proceedings of the XVI International Congress of Clinical Chemistry, London, UK, AACB 1996
- Brooks Z, Plaut D, Massarella G. How total error can save time and money for the lab. Medical Laboratory Observer, Nov. 1994, 48-54
- Brooks Z, Plaut D, Massarella G. Using total allowable error to assess performance, qualify reagents and calibrators, and select quality control rules: real world examples. AACC Poster, New York, 1993
- Brooks Z, Plaut D, Massarella G. Using total allowable error to qualify reagents and calibrators. AACC Poster, Chicago, 1992
References
- Yogi Berra Quotes www.brainyquote.com/quotes/authors/y/yogi_berra.html
- Fraser CG. Biological variation and quality for POCT. www.bloodgas.org, Quality assurance, Jun 2001
- Klee GG. Quality management of blood gas assays. www.bloodgas.org, Quality assurance, Jun 2001
- Westgard JO. Quality planning and control strategies. www.bloodgas.org, Quality assurance, Jun 2001
- Ehrmeyer SS. U.S. quality assurance regulations for decentralized testing. www.bloodgas.org, Point-of-care testing, Oct 2002
- Westgard JO. A six sigma primer. www.bloodgas.org, Quality assurance, Oct 2002
- Bais R. The use of capability index for running and monitoring quality control. www.bloodgas.org, Quality assurance, Jan 2003
- Kristensen HB. Proficiency testing versus QC-data comparison programs. www.bloodgas.org, Quality assurance, Oct 2003
- Thomas A. What is EQA - just another word for proficiency testing? www.bloodgas.org, Quality assurance, Jan 2004
- Ehrmeyer SS, Laessig RH. The new CLIA quality control regulations and blood gas testing. www.bloodgas.org, Quality assurance, Feb 2004
- Tonks DB. A study of the accuracy and precision of clinical chemistry determinations in 170 Canadian laboratories. Clin Chem 1963; 9: 217-23.
- Westgard JO, Quam EF, Barry PL. Selection grids for planning QC procedures. Clin Lab Sci 1990; 3: 271-78
- Fraser CG, Kallner A, Kenny D, Hyltoft Petersen P. Introduction: strategies to set global quality specifications in laboratory medicine. Scand J Clin Lab Invest 1999; 59: 477-78.
- Brooks, Z. Performance-driven quality control. AACC Press, Washington DC, 2001 ISBN 1-899883-54-9
- Brooks, Z. Quality Control – From Data to Decisions. Basic Concepts, Trouble Shooting, Designing QC Systems. Educational Courses. Zoe Brooks Quality Consulting. 2003
- Brooks Z, Plaut D, Begin C, Letourneau A. Critical systematic error supports use of varied QC rules in routine chemistry. AACC Poster San Francisco 2000
- Brooks Z, Massarella G. A computer programme that quickly and rapidly applies the principles of total error in daily quality management. Proceedings of the XVI International Congress of Clinical Chemistry, London, UK, AACB 1996
- Brooks Z, Plaut D, Massarella G. How total error can save time and money for the lab. Medical Laboratory Observer, Nov. 1994, 48-54
- Brooks Z, Plaut D, Massarella G. Using total allowable error to assess performance, qualify reagents and calibrators, and select quality control rules: real world examples. AACC Poster, New York, 1993
- Brooks Z, Plaut D, Massarella G. Using total allowable error to qualify reagents and calibrators. AACC Poster, Chicago, 1992
May contain information that is not supported by performance and intended use claims of Radiometer's products. See also Legal info.
Acute care testing handbook
Get the acute care testing handbook
Your practical guide to critical parameters in acute care testing.
Download nowScientific webinars
Check out the list of webinars
Radiometer and acutecaretesting.org present free educational webinars on topics surrounding acute care testing presented by international experts.
Go to webinars


