Printed from acutecaretesting.org
July 2006
Quality control… the gap deepens
INTRODUCTION
What do you think? If a group of experienced laboratory professionals examined a series of quality control charts, would it be reasonable to expect them to generally agree whether or not those charts reflected an analytical process that meets clinical need?
If you posed a series of questions on theoretical concepts of basic principles of laboratory quality control, would you expect these laboratory professionals to agree?
Thanks to this wonderful Internet age we live in, and the good folks who completed these online quizzes, we can compare your expectations to a sampling of reality.
I would like to sincerely thank the 21 brave souls, at the time of writing, who completed the "Quiz with QC charts for evaluation".
"QUIZ WITH QC CHARTS FOR EVALUATION"
There were four online quizzes or opinion polls. The most interesting patterns and concepts were seen in the "Quiz with QC charts for evaluation". This quiz had 11 questions, each with the following choice of answers:a) I agree completely
b) I think so
c) I don't think so
d) I disagree completely
e) There is not enough information to decide
For ease of analysis in this essay, I condensed the answers into three mutually exclusive choices:
1. I agree, or think so 2. I disagree, or think not 3. There is not enough information to decideWhy not play along
Before you scroll down to see the questions, make a table of question numbers 1-11 and the answer choices above to check off your answers:TABLE 1 presents questions 1-6, involving examination of a QC chart and assessment of clinical acceptability of methods.
| QUESTION | ||||||||||||||
|
||||||||||||||
|
||||||||||||||
|
||||||||||||||
|
||||||||||||||
|
||||||||||||||
|
||||||||||||||
TABLE 1
TABLE 2 presents questions 7-11 dealing with basic theoretical concepts.
| Question | ||
|
||
|
||
|
||
|
||
|
TABLE 2
QUIZ RESULTS AND DISCUSSION
Practical questions – assessments of QC charts
The first six questions involved examination of QC charts. The percentage of the 21 people selecting each answer is shown in FIGURE 1. My chosen correct answer is indicated by the star.
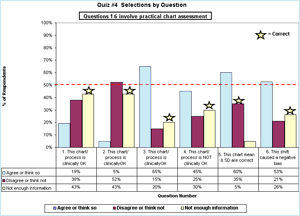
FIGURE 1: Click for enlargement
Discussion
As introduced in the acutecaretesting.org essay I found the gap its in the basement to decide if a QC sample reflects a method that meets clinical need, you need to know each of four cornerstones of quality,
- The best estimate of the true value for a QC sample (the number you should get).
- The allowable error limit (maximum variation before results are unacceptable).
- The current actual/observed/measured mean value of a single Gaussian data set.
- The current actual/observed/measured standard deviation of the same Gaussian data set.
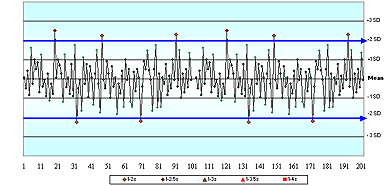
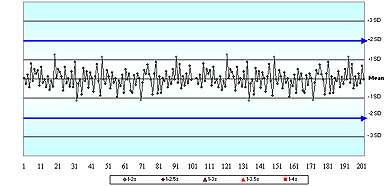
In questions 1 and 2, even though there were no values provided for any of the four cornerstones (or even the analyte name), only 43 % of respondents said there was not enough information to assess the acceptability of these QC charts.
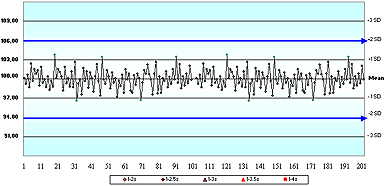
Questions 3, 4, 5 and 6 used variations of QC charts for glucose where the information provided included the allowable error limit and the assigned mean and SD values. No values were provided for the true value, or for the current actual/observed/ measured mean and SD.
In question 3, a stable data pattern with all results within ±2 assigned SD, only 20 % of respondents correctly indicated there was not enough information to decide whether or not this QC sample represented a method that met clinical need.
Without knowing the true value, how could you assess accuracy or total error?
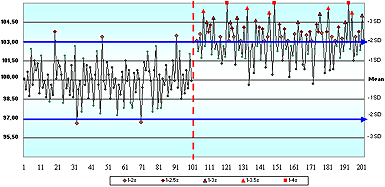
In question 4, where the QC chart showed a dramatic shift of +2 SD, 45 % of respondents thought that "the change observed with this shift would cause this method to no longer meet clinical need."
Twenty-five percent thought the method would still be OK after the shift. Only 30 % said there was not enough information to decide whether or not this QC sample represented a method that met clinical need.
That is an incredibly even split of opinions – when you consider that only one of those answers can possibly be right! Think about it.
If you do not have enough information, then you cannot decide if the method is OK or Not OK. If you do have enough information, then it is either OK or Not OK. Only one answer can be right!
Over half the people got this question (and others) wrong!
Remember the introduction from the acutecaretesting.org essay Quality control in theory and practice a gap analysis: "Millions of times every day, in a myriad of distinctive laboratories around this globe, front-line workers make the final decision on the quality of results they report.
If they decide the quality is "OK", patient results are released to impact clinical decisions, and proficiency values reflect the overall ability of the laboratory to meet performance standards."
I think the QC charts in question 3, 4 and 6 show oversimplified versions of the type of quality control decisions that are made "millions of times every day…" Is the system OK, or still OK after a shift?
Would you agree that the majority of laboratory workers should reach the same decision for this type of question?
The most common choice in question 4 was that "this method no longer met clinical need!".
This decision would likely lead to spending time, money and effort to correct the unacceptable quality, and to the delay of patient results. Was that the right decision? I would say "No. There is not enough information to decide."
Question 5 asked if "the mean and SD values assigned on this QC chart reflect the observed accuracy and precision of this QC sample". Only 35 % of respondents disagreed, presumably because they recognized that the SD assigned on this QC chart was double the observed SD.
The acutecaretesting.org essay I found the gap its in the basement: presented examples of how this practice reduces the ability of staff to detect a shift in the mean. Assigning the SD at higher than its actual value is one of the greatest contributing factors in the QC gap.
It is difficult to eliminate this problem if only 35 % of people can recognize the problem!
In question 6, a negative shift in the mean occurred midway through the time period. When asked if "This method exhibits a negative bias following the shift in the mean", 53 % agreed, 21 % disagreed and only 26 % correctly concluded that they did not have enough information to decide.
The information provided for this question did not include cornerstone #1: the true value. Bias is the variation between the measured mean and true value. Many people look at a QC chart and assume that the assigned mean value is the true value.
That false assumption contributes to the gap between QC theory and practice.
Questions on theoretical QC concepts
The dispersion of the percentage of the 21 people selecting each answer for questions 7-11 is shown in FIGURE 2.
My chosen correct answer is indicated by the star. Theoretically, the majority of laboratory professionals agree – unlike when they were asked to practice that QC theory with specific QC charts as discussed above.
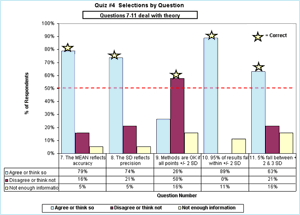
FIGURE 2: Click for enlargement
The gap between perception and reality
In contemplating how this gap between QC theory and practice thrives in a scientific world, I have come to suspect the existence of another deeper, more worrisome, gap that makes this first gap difficult to fill: a gap between perception and reality.
In other words, what people perceive to be true about laboratory quality is often not really so.
TABLE 3 compares perception (based on what I have seen and heard over years of discussions with a wide variety of laboratory professionals in many settings) to reality (based on scientific studies, literature references and conversations with quality control experts).
I realize that the material in this table may be controversial and apologize if it offends anyone. I hope you will use this as an incentive to examine your QC practices and open discussions with your staff and colleagues.
As I have stated in the previous essays: these are my personal observations and opinions. I sincerely hope that many will stand up and prove me wrong! Indeed, this should not be true!
| Perception – what some people believe | Reality – based on my observations and experience |
| Laboratories practice sound quality control theory. |
The practices in use would not be sanctioned by quality control experts. |
| Laboratories monitor and control method accuracy. | They seldom set a true value for QC samples. Accuracy, by definition, is agreement with the true value. |
| QC samples will detect and reflect change in the patient population. | Some QC samples show no change in measured values when patient samples change significantly. |
| Examination of shifts and trends on QC charts will immediately alert users to change in the accuracy or precision of analytical processes. | QC charts are often created with assigned mean and SD values that do not reflect actual current performance. Significant change will not be noticed if SD values are assigned on QC charts higher than their observed values. |
| They are using the Westgard rules. | Variations of these rules have evolved over time that bear little resemblance to the originals. In online Quiz #3, QC statistics – confusion or comprehension?, only five of 17 respondents were able to name the same Westgard rules that I know. |
| QC rules will immediately alert them to change in method accuracy or precision so corrective action can be taken before bad patient results are reported. | Even in a properly designed system using the original Westgard rules, small shifts cannot be detected for several runs. |
| They can monitor quality by examining a QC chart: as long as results fall within ±2 SD on a QC chart, the analytical system meets clinical needs. | The QC chart reflects only observed performance. Without a separate comparison to acceptable performance (true value and TEa limits) there is no way to judge if a method meets clinical need. |
| It is acceptable to use the same QC rules and strategy for every analytical process at all times. | Method performance changes with unavoidable events such as reagent or calibrator changes. Some methods are more technically challenging and always operate close to the limit of the performance standard. QC practices must change to compensate for the relationship between observed performance and the performance standard. If results must fall within 10 % of the true value and current accuracy and precision sees them falling 9 % from true, then choose a strategy to watch very closely. If results must fall within 10 % of the true value and current accuracy and precision sees them falling only 2 % from true, then choose a less demanding QC strategy to minimize false rejects. In the online Quiz #3, QC statistics – confusion or comprehension?, only one of 17 people indicated that QC would vary QC rules to match performance. |
| Good proficiency test results equate to good laboratory quality. | Proficiency surveys consist of only a few samples tested over large time intervals, and results are often received weeks after the event. Changes that occur between proficiency surveys can seriously impact patient outcomes, if internal QC practices fail to detect them. |
| Good peer review results equate to good laboratory quality. |
Peer comparisons merely tell you that you are performing about the same as others using your method. There is no link to clinical need. |
| Laboratories consistently ensure that the results they report to clinicians are close enough to the true value to allow the clinician to make the correct medical decision. | Laboratories seldom define performance standards that state the maximum allowable variation from the true value for QC samples. |
TABLE 3: The gap between perception and reality
Now, please read again only the left side of that table.
Here's the problem:
- The people who believe only the left side of that table do not see the gap between QC theory and practice.
- The people who are in a position to do something to close the gap often do not see it. They think theory is being applied correctly and no problem exists.
- People who realize the gap between QC theory and practice exists are generally not in a position to close the gap.
As I said… the gap deepens.
CONCLUSION
What do you think?
Do these gaps exist?
Did this group of experienced laboratory professionals agree closely enough that the sample QC charts reflected analytical processes that meet clinical need?
Did enough of them agree on theoretical concepts of basic principles of laboratory quality control?
What would happen if you tried quizzes like this in your laboratory?
I remain convinced that medical laboratory quality control is not generally practiced in a manner that reflects the theory recommended by experts and authorities.
Once again, these are my observations, and I truly hope that many of you will stand up and prove me wrong. If you would like to discuss this essay, or test your quality savvy with a new quiz, log on to www.zoebrooksquality.com/harmonize.
You will find:
- A new quiz with blood gas QC examples
- More details on the gap between perception and reality
- Summaries of the original four quizzes and opinion polls
- Additional details for the "Quiz with QC charts for evaluation" with scenarios using the four cornerstones
- Discussion forums related to the quizzes, concepts and gap(s)
References+ View more
- Online quizzes and discussions at www.zoebrooksquality.com/moodle/course/view.php?id=35
- Westgard JO, Burnett RW, Bowers GN. Quality management science in clinical chemistry: A dynamic framework for continuous improvement of quality. Clin Chem 1990; 36; 1712-16.
- Fraser CG. Biological variation and quality for POCT. www.acutecaretesting.org, 2001.
- Klee GG. Quality management of blood gas assays. www.acutecaretesting.org, 2001.
- Westgard JO.Quality planning and control strategies. www.acutecaretesting.org 2001.
- Westgard JO. A six sigma primer desc. www.acutecaretesting.org, 2002
- Bais R. The use of capability index for running and monitoring quality control. www.acutecaretesting.org, 2003
- Kristensen HB. Proficiency testing versus QCdatacomparison programs. www.acutecaretesting.org, 2003
- Thomas A. What is EQA www.acutecaretesting.org, 2004
- Ehrmeyer SS, Laessig RH. The new CLIA quality control regulations and blood gas testing. www.acutecaretesting.org, 2004
- Tonks DB. A study of the accuracy and precision of clinical chemistry determinations in 170 Canadian laboratories. Clin Chem 1963; 9: 217-23.
- Westgard JO, Quam EF, Barry PL. Selection grids for planning QC procedures. Clin Lab Sci 1990; 3: 271-78
- Fraser CG, Kallner A, Kenny D, Hyltoft Petersen P. Introduction: strategies to set global quality specifications in laboratory medicine. Scand J Clin Lab Invest 1999; 59: 477-78.
- Brooks, Z. Performance-driven quality control. AACC Press, Washington DC, 2001 ISBN 1-899883-54-9
- Brooks, Z. Quality Control – From Data to Decisions. Basic Concepts, Trouble Shooting, Designing QC Systems. Educational Courses. Zoe Brooks Quality Consulting. 2003
- Brooks Z, Plaut D, Begin C, Letourneau A. Critical systematic error supports use of varied QC rules in routine chemistry. AACC Poster San Francisco 2000
- Brooks Z, Massarella G. A computer programme that quickly and rapidly applies the principles of total error in daily quality management. Proceedings of the XVI International Congress of Clinical Chemistry, London, UK, AACB 1996
- Brooks Z, Plaut D, Massarella G. How total error can save time and money for the lab. Medical Laboratory Observer, Nov. 1994, 48-54
- Brooks Z, Plaut D, Massarella G. Using total allowable error to assess performance, qualify reagents and calibrators, and select quality control rules: real world examples. AACC Poster, New York, 1993
- Brooks Z, Plaut D, Massarella G. Using total allowable error to qualify reagents and calibrators. AACC Poster, Chicago, 1992
References
- Online quizzes and discussions at www.zoebrooksquality.com/moodle/course/view.php?id=35
- Westgard JO, Burnett RW, Bowers GN. Quality management science in clinical chemistry: A dynamic framework for continuous improvement of quality. Clin Chem 1990; 36; 1712-16.
- Fraser CG. Biological variation and quality for POCT. www.acutecaretesting.org, 2001.
- Klee GG. Quality management of blood gas assays. www.acutecaretesting.org, 2001.
- Westgard JO.Quality planning and control strategies. www.acutecaretesting.org 2001.
- Westgard JO. A six sigma primer desc. www.acutecaretesting.org, 2002
- Bais R. The use of capability index for running and monitoring quality control. www.acutecaretesting.org, 2003
- Kristensen HB. Proficiency testing versus QCdatacomparison programs. www.acutecaretesting.org, 2003
- Thomas A. What is EQA www.acutecaretesting.org, 2004
- Ehrmeyer SS, Laessig RH. The new CLIA quality control regulations and blood gas testing. www.acutecaretesting.org, 2004
- Tonks DB. A study of the accuracy and precision of clinical chemistry determinations in 170 Canadian laboratories. Clin Chem 1963; 9: 217-23.
- Westgard JO, Quam EF, Barry PL. Selection grids for planning QC procedures. Clin Lab Sci 1990; 3: 271-78
- Fraser CG, Kallner A, Kenny D, Hyltoft Petersen P. Introduction: strategies to set global quality specifications in laboratory medicine. Scand J Clin Lab Invest 1999; 59: 477-78.
- Brooks, Z. Performance-driven quality control. AACC Press, Washington DC, 2001 ISBN 1-899883-54-9
- Brooks, Z. Quality Control – From Data to Decisions. Basic Concepts, Trouble Shooting, Designing QC Systems. Educational Courses. Zoe Brooks Quality Consulting. 2003
- Brooks Z, Plaut D, Begin C, Letourneau A. Critical systematic error supports use of varied QC rules in routine chemistry. AACC Poster San Francisco 2000
- Brooks Z, Massarella G. A computer programme that quickly and rapidly applies the principles of total error in daily quality management. Proceedings of the XVI International Congress of Clinical Chemistry, London, UK, AACB 1996
- Brooks Z, Plaut D, Massarella G. How total error can save time and money for the lab. Medical Laboratory Observer, Nov. 1994, 48-54
- Brooks Z, Plaut D, Massarella G. Using total allowable error to assess performance, qualify reagents and calibrators, and select quality control rules: real world examples. AACC Poster, New York, 1993
- Brooks Z, Plaut D, Massarella G. Using total allowable error to qualify reagents and calibrators. AACC Poster, Chicago, 1992
May contain information that is not supported by performance and intended use claims of Radiometer's products. See also Legal info.
Acute care testing handbook
Get the acute care testing handbook
Your practical guide to critical parameters in acute care testing.
Download nowScientific webinars
Check out the list of webinars
Radiometer and acutecaretesting.org present free educational webinars on topics surrounding acute care testing presented by international experts.
Go to webinars


