Printed from acutecaretesting.org
January 2006
Quality control in theory and practice – a gap analysis


I am delighted to have this opportunity to present some thoughts on quality control for your consideration. Many excellent articles previously presented have described the critical elements required to design a quality control process.
Rather than put forward another iteration of how quality control should be performed in theory, I have chosen to use this opportunity to present some informal personal observations on the gap between QC theory and practice.
These are my observations, and I truly hope that many of you will stand up and prove me wrong.
I have worked in the trenches and been called in to a fifty-bed hospital at 3:00 AM to test blood gases on a critically ill patient.
I have actually heard the words (yes, from a doctor) that these front-line workers should hear every day “What you did tonight probably saved that patient’s life”.
I have had the privilege of teaching QC courses and seminars for many years now, and I know the level of dedication and care that our front-line workers bring to their job every day.
In labs that I managed, I have repeatedly seen the most junior staff give up their breaks, skip lunch and stay late because they were worried about the quality of their results.
I fear that somehow the system has failed to give these critically important front liners the fundamental understanding of quality concepts they need to always make good decisions.
THE GAP
There appears to be a huge gap between QC theory and QC practice. In my experience, the fundamental building blocks of quality control are poorly understood and applied at the front line in the laboratory.
The following vignettes from my personal experience are but a few of the many examples I have seen of the dramatic disparity between theory and reality.
1. In 1994/1995, David Plaut and I conducted a basic quiz on quality control at the start of workshops we each presented in Canada and the USA, and collated the results for a poster at AACC.
The average score was 38 %! Less than half the people who cared enough to come to a full-day workshop on QC could differentiate accuracy from precision, or identify which numerical indicators are associated with these fundamentals.
2. In 2005, I asked graduate students starting an online university course to complete a quiz where they assessed QC charts and answered questions on basic concepts.
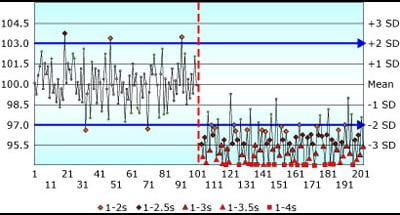
The results did not reflect a good baseline of fundamental understanding of QC concepts. Figure 1 shows a QC chart from that quiz.
The question was: “Assume that the pattern on the chart shown is similar for all control samples for a laboratory analyte – in this instance Blood Glucose, where CLIA requirements are set at ±10 % or 6 mg/dL.
A shift in the mean occurred midway through the time period. If you were the supervisor examining the following QC chart, to what degree would you agree or disagree with the following statement: "This method exhibits a negative bias following the shift in the mean".
(Make a note of your answer; more discussion will follow later in this paper).
- I disagree completely
- I don't think so
- I do not know
- There is not enough information provided to answer this question
- I think so
- I agree completely
FIGURE 1: Shift in the mean of -3 SD; Assigned SD = Observed SD
3. In 2001, I conducted a benchmarking study involving 21 laboratories in Canada and the USA. Most participants found it difficult to define a true value and an allowable error limit for their QC samples.
More significantly, most labs reported assigned SD values on QC charts that were two, three or five times higher than the actual method SD.
Somehow the very basic premise of “put the mean and SD on the QC chart” has been lost. It has become “put numbers on the QC chart so the chart looks good and you don’t get QC flags”.
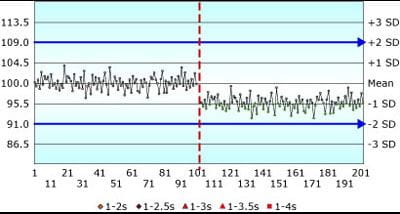
If the observed SD is 1.5 units, as in Fig. 1 above, and you assign the SD on the QC chart as 4.5 units (3 × the observed SD), as in Fig. 2 below, the same shift in the mean of -3 observed SD will appear insignificant.
QC rules are “crippled” by the all-too-common practice of artificially inflating the assigned SD.
FIGURE 2: Shift in the mean of -3 SD; Assigned SD = 3 × Observed SD
4. I recently saw a vicious cycle repeating itself where a dean felt it was not the college’s responsibility to teach the fundamentals of quality control to medical technologists, as the students would learn QC in their clinical year.
Here’s the catch: most of the staff at the clinical site had graduated from that same college!
5. I have seen good people, with the very best of intentions, design absolutely bizarre and ineffectual QC systems.
6. I’ve had a tech look me in the eye with no compulsion and say, “The only way I could get rid of the QC flags for phosphorous was to turn off all the Westgard rules”.
(You know how it works: you can’t report results if you have QC flags. His job was to get rid of the QC flags).
7. I’ve seen the oddest blank stare when I asked if patient results were verified, after observing a recurring pattern of failures on a QC chart and being told, “Oh, that’s nothing.
The reagent goes off if it’s out too long. When we see this, we just replace the reagent, rerun the QC and it’s fine.”
These dedicated technologists had not been trained to understand that the reagent may have gone off moments after their last QC run four hours ago, and clinically misleading patient results may have been reported.
8. I have seen days and dollars wasted and patient results delayed while concerned front liners investigate perceived QC problems that were of no clinical consequence.
WHERE WE SHOULD BE
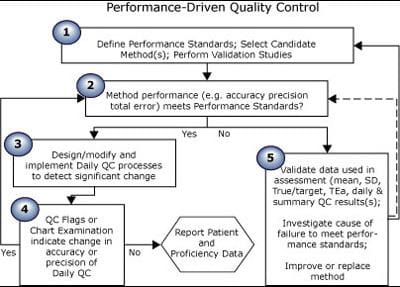
FIGURE 3 is a flow chart of how quality control is theoretically implemented, when the QC process is driven by the quality requirement. Text below the chart explains how each step is performed.
This is QC in the ideal world; another flow chart (FIGURE 4) will illustrate how QC is often performed in the real world.
FIGURE 3: Theoretical quality control process
| Step no. | Process for theoretical quality control |
| 1 | Research and select an analytical process that will produce results at a rate of x to y per day, at a cost of x to y each, with accuracy of x % and precision of y %. Define performance standards for each analyte: if a sample has a true value of x units, reported results must be within x units or y % of that value. |
|
2 |
Ensure performance standards are met before reporting any results. |
| 3 | Select QC samples. Select a QC strategy consisting of frequency of testing, QC rules and processes to create and examine QC charts. Choose a QC strategy that will always detect changes that would cause any results to fail to meet the defined performance standard. |
| 4 |
Test QC samples. Plot all results on QC charts. Apply rules. Examine charts. |
| 5 | If your method no longer meets performance standards, then stop reporting results while you make sure the numbers are correct and take corrective action, if indicated. |
WHERE WE ARE
I believe the system has failed to give front-line laboratory staff the knowledge and tools they need to make valid quality decisions.
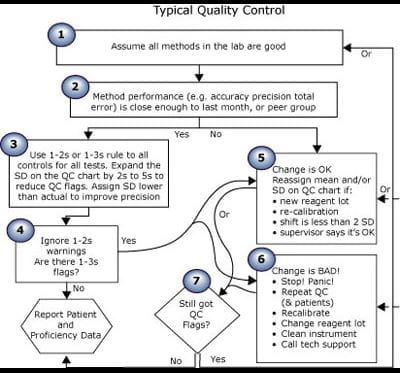
Unlike the theoretical Performance-Driven Quality Control model above, Fig. 4 illustrates a composite of implementations of QC that I see.
FIGURE 4: Composite of typical quality control process
| Step no. | Process for typical control |
| 1 | This is a good lab. We are good people. Our methods are all good. |
|
2 |
Peer comparison shows that we get about the same results as other labs using the same methods. |
| 3 |
Someone (who cannot be questioned) decided to use a 1-2s or 1-3s rule for all controls on all tests. |
| 4 |
Are there QC flags? |
| 5 |
Change is OK if the supervisor says so. |
| 6 | All change is bad. It must be eliminated. |
| 7 |
Are there still QC flags when you repeat? |
DISCUSSION
Despite the plethora of scientific articles promoting performance standards and error limits in the past almost four decades now, most front-line workers I meet, not to mention a fair number of senior staff, inspectors and PT officials, still believe that:
1. “quality is good as long as all results are within ±2 SD” and
2. “it’s OK to put a mean and SD on the QC chart that do not reflect the actual current observed mean and SD of each QC sample”.
Just because your QC results are within 2 SD does not mean they are good! It just means they are the same as they were. When labs receive notice that proficiency testing shows that their results fail to meet defined standards, the first response is often “But my QC is fine!
All of the results are within ±2 SD”. That’s like being stopped by a policeman for speeding and saying “No way! I use cruise control and my speed never varied by more than 2 km/hr!” If your doctor said you were overweight or underweight, would you argue “But I always weigh this much, plus or minus no more than 2 pounds!”
Just because you get the same number does not make that number right!
So the answer to the quiz chart is: “There is not enough information provided to answer this question.” Bias is the difference between the measured mean and the true value.
In this example, you have no indication of the true value for this sample. You cannot assess quality with only a QC chart! This shift may bring the reported results closer to the true value and actually reduce bias.
Change is not always bad. You cannot assess quality if you cannot define quality!
Who is responsible for making the leap from theory to practice – implementing policies and procedures that reliably and repeatedly answer the question “Are these patient results OK?”
I can assure you from personal experience that quality control concepts were not taught well in the early seventies.
Many from this/my generation are now in senior positions, where they are responsible for designing, implementing and monitoring quality systems.
Most proficiency testing programs monitor quality by periodically looking for failure. Defects are found only if both (1) the analytical process is deficient at the time of the survey and (2) the QC process fails to detect that deficiency.
Fortunately, manufacturers ensure that analytical failures are rare. QC process failures, I suspect, are far more common. Perhaps, rather than retrospectively detecting failure that has already caused damage, more regulatory effort should be placed on examination of the validity of the QC process.
Then we may see more focus on implementation of the abundance of solid-quality theories that exist to proactively maintain systems within defined quality standards. Before you fail, examine the gap!
As I said, these are my observations, and I truly hope that many of you will stand up and prove me wrong.
If you would like to discuss this essay, or test your quality savvy with the quizzes mentioned above, log on to www.zoebrooksquality.com/harmonize.
References+ View more
- Fraser CG. Biological variation and quality for POCT. www.bloodgas.org, Quality assurance, Jun 2001
- Klee GG. Quality management of blood gas assays. www.bloodgas.org, Quality assurance, Jun 2001
- Westgard JO. Quality planning and control strategies. www.bloodgas.org, Quality assurance, Jun 2001
- Ehrmeyer SS. U.S. quality assurance regulations for decentralized testing. www.bloodgas.org, Point-of-care testing, Oct 2002
- Westgard JO. A six sigma primer. www.bloodgas.org, Quality assurance, Oct 2002
- Bais R. The use of capability index for running and monitoring quality control. www.bloodgas.org, Quality assurance, Jan 2003
- Skurup A. Method comparison or procedure comparison? www.bloodgas.org, Point-of-care testing, Apr 2003
- Sarewitz SJ. What you need to know about the new CAP checklists. www.bloodgas.org, Quality assurance, Jul 2003
- Kristensen HB. Proficiency testing versus QC-data comparison programs. www.bloodgas.org, Quality assurance, Oct 2003
- Thomas A, What is EQA - just another word for proficiency testing? www.bloodgas.org, Quality assurance, Jan 2004
- Ehrmeyer SS, Laessig RH. The new CLIA quality control regulations and blood gas testing. www.bloodgas.org, Quality assurance, Feb 2004
- Tonks DB. A study of the accuracy and precision of clinical chemistry determinations in 170 Canadian laboratories. Clin Chem 1963; 9: 217-23.
- Westgard JO, Quam EF, Barry PL. Selection grids for planning QC procedures. Clin Lab Sci 1990;3;271-78
- Fraser CG, Kallner A, Kenny D, Hyltoft Petersen P. Introduction: strategies to set global quality specifications in laboratory medicine. Scand J Clin Lab Invest 1999; 59: 477-78.
- Brooks, Z. Performance-driven quality control. AACC Press, Washington DC, 2001 ISBN 1-899883-54-9
- Brooks Z, Plaut D, Begin C, Letourneau A. Critical systematic error supports use of varied QC rules in routine chemistry. AACC Poster San Francisco 2000
- Brooks Z, Massarella G. A computer programme that quickly and rapidly applies the principles of total error in daily quality management. Proceedings of the XVI International Congress of Clinical Chemistry, London, UK, AACB 1996
- Brooks Z, Plaut D, Massarella G. How total error can save time and money for the lab. Medical Laboratory Observer, Nov. 1994, 48-54
- Brooks Z, Plaut D, Massarella G. Using total allowable error to assess performance, qualify reagents and calibrators, and select quality control rules: real world examples. AACC Poster, New York, 1993
- Brooks Z, Plaut D, Massarella G. Using total allowable error to qualify reagents and calibrators. AACC Poster, Chicago, 1992
References
- Fraser CG. Biological variation and quality for POCT. www.bloodgas.org, Quality assurance, Jun 2001
- Klee GG. Quality management of blood gas assays. www.bloodgas.org, Quality assurance, Jun 2001
- Westgard JO. Quality planning and control strategies. www.bloodgas.org, Quality assurance, Jun 2001
- Ehrmeyer SS. U.S. quality assurance regulations for decentralized testing. www.bloodgas.org, Point-of-care testing, Oct 2002
- Westgard JO. A six sigma primer. www.bloodgas.org, Quality assurance, Oct 2002
- Bais R. The use of capability index for running and monitoring quality control. www.bloodgas.org, Quality assurance, Jan 2003
- Skurup A. Method comparison or procedure comparison? www.bloodgas.org, Point-of-care testing, Apr 2003
- Sarewitz SJ. What you need to know about the new CAP checklists. www.bloodgas.org, Quality assurance, Jul 2003
- Kristensen HB. Proficiency testing versus QC-data comparison programs. www.bloodgas.org, Quality assurance, Oct 2003
- Thomas A, What is EQA - just another word for proficiency testing? www.bloodgas.org, Quality assurance, Jan 2004
- Ehrmeyer SS, Laessig RH. The new CLIA quality control regulations and blood gas testing. www.bloodgas.org, Quality assurance, Feb 2004
- Tonks DB. A study of the accuracy and precision of clinical chemistry determinations in 170 Canadian laboratories. Clin Chem 1963; 9: 217-23.
- Westgard JO, Quam EF, Barry PL. Selection grids for planning QC procedures. Clin Lab Sci 1990;3;271-78
- Fraser CG, Kallner A, Kenny D, Hyltoft Petersen P. Introduction: strategies to set global quality specifications in laboratory medicine. Scand J Clin Lab Invest 1999; 59: 477-78.
- Brooks, Z. Performance-driven quality control. AACC Press, Washington DC, 2001 ISBN 1-899883-54-9
- Brooks Z, Plaut D, Begin C, Letourneau A. Critical systematic error supports use of varied QC rules in routine chemistry. AACC Poster San Francisco 2000
- Brooks Z, Massarella G. A computer programme that quickly and rapidly applies the principles of total error in daily quality management. Proceedings of the XVI International Congress of Clinical Chemistry, London, UK, AACB 1996
- Brooks Z, Plaut D, Massarella G. How total error can save time and money for the lab. Medical Laboratory Observer, Nov. 1994, 48-54
- Brooks Z, Plaut D, Massarella G. Using total allowable error to assess performance, qualify reagents and calibrators, and select quality control rules: real world examples. AACC Poster, New York, 1993
- Brooks Z, Plaut D, Massarella G. Using total allowable error to qualify reagents and calibrators. AACC Poster, Chicago, 1992
May contain information that is not supported by performance and intended use claims of Radiometer's products. See also Legal info.


Acute care testing handbook
Get the acute care testing handbook
Your practical guide to critical parameters in acute care testing.
Download now
Scientific webinars
Check out the list of webinars
Radiometer and acutecaretesting.org present free educational webinars on topics surrounding acute care testing presented by international experts.
Go to webinars